in_tradingviewhace 35d
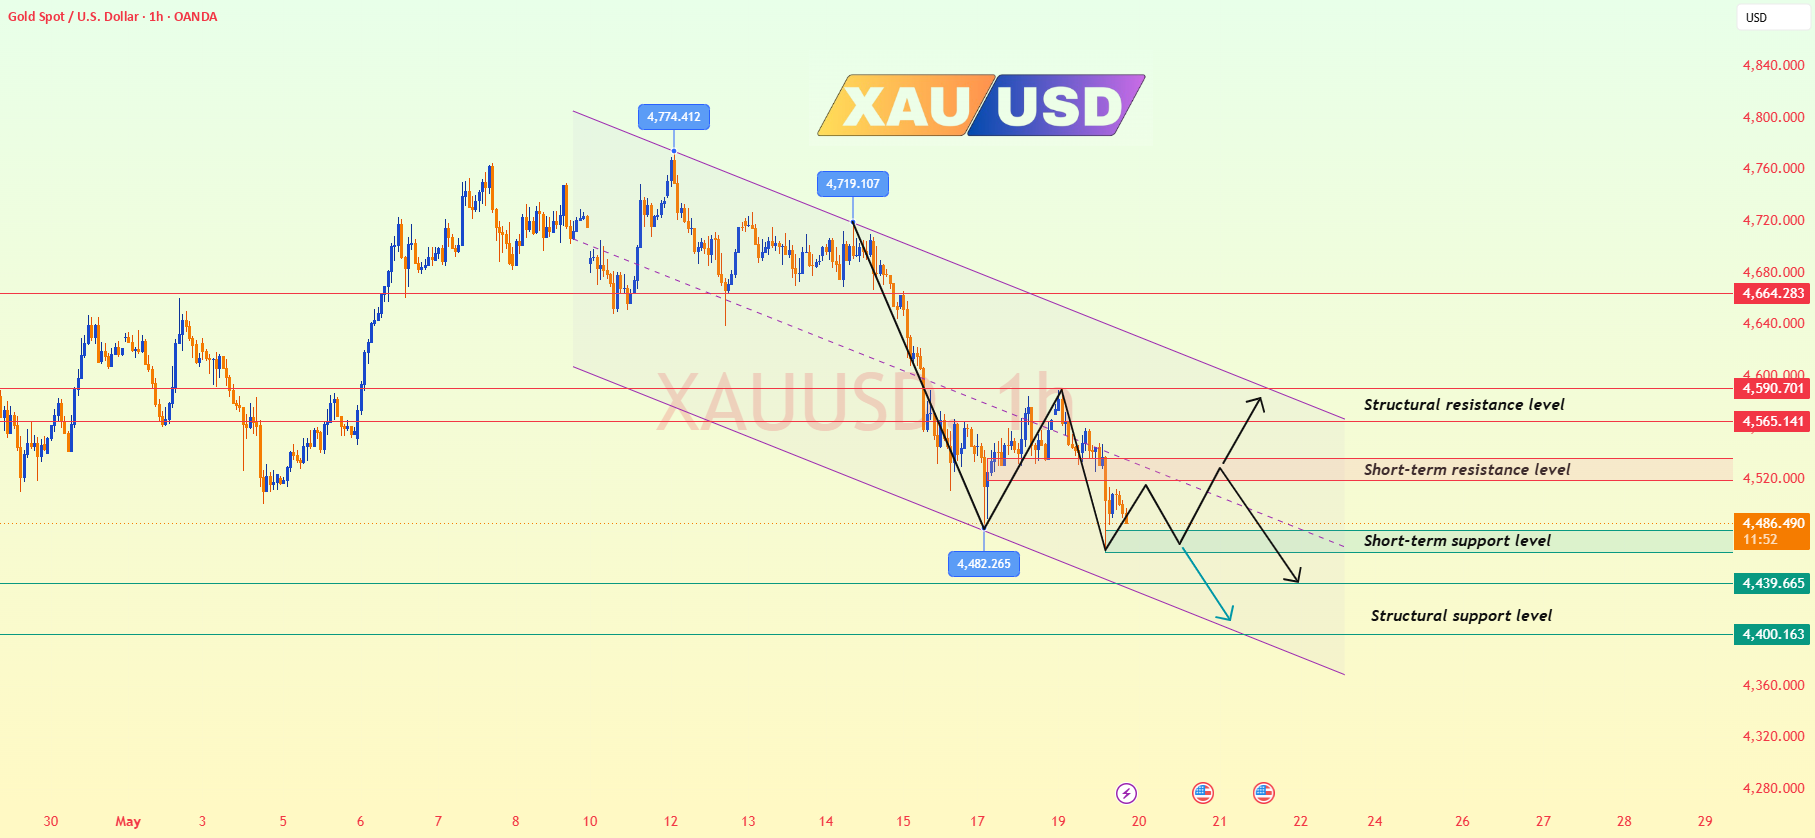
¡Hola comerciantes! Soy Jack Blackwell, con 15 años de experiencia en análisis y negociación en los mercados de futuros y forex. A continuación se muestran mis vistas de análisis técnico basadas en la estructura gráfica actual del XAUUSD (plazos de tiempo de 4H y 1H). ✅ Análisis de tendencia de 4 horas Según el gráfico de 4 horas, la tendencia bajista general del oro se ha fortalecido nuevamente. Después de entrar previamente en una fase de consolidación y recuperación dentro del rango 4550-4580, el precio no logró superar el MA20 (4565) y la resistencia de la banda media de Bollinger, luego reanudó su movimiento a la baja. El precio actual ya rompió por debajo del nivel de soporte clave en 4503 y tocó un mínimo cerca de 4465, lo que indica que el impulso bajista continúa expandiéndose. En cuanto a las medias móviles, la MA5 (4530) ha vuelto a cruzar por debajo de la MA10 (4541), formando una alineación bajista junto con la MA20 (4565), lo que sugiere que la tendencia bajista a medio plazo se mantiene intacta. ✅ Análisis de tendencias de 1 hora El gráfico de 1 hora muestra que después de una breve consolidación cerca de 4524, el oro experimentó otra ola de fuerte presión de venta y rompió decisivamente por debajo del nivel de soporte 4503. Las Bandas de Bollinger se han abierto nuevamente a la baja, lo que indica que la volatilidad a corto plazo se está expandiendo y se ha reanudado la tendencia bajista. El MACD se mantiene por debajo de la línea cero con un cruce bajista continuo, mientras que el impulso bajista continúa fortaleciéndose, manteniendo débil la perspectiva a corto plazo. La estructura actual de 1 hora refleja una “continuación débil después de una caída”, sin que todavía aparezca una señal clara de reversión. 📊 Análisis de retroceso de Fibonacci Utilizando la reciente caída desde el máximo de 4773 hasta el mínimo de 4465, los niveles de retroceso de Fibonacci son los siguientes: ● 23,6 % de retroceso: 4538 ● 38,2 % de retroceso: 4582 ● 50 % de retroceso: 4619 ● 61,8 % de retroceso: 4656 El precio actual ya ha caído por debajo del nivel de retroceso del 23,6% en 4538, lo que indica que la estructura del mercado sigue siendo extremadamente débil en general. Si el precio no logra recuperarse y mantenerse por encima de 4538, es probable que la tendencia bajista continúe extendiéndose hacia abajo. Sólo una ruptura por encima de 4582 comenzaría a establecer una estructura de rebote a corto plazo. 🔴 Niveles de resistencia ● 4520–4538 (zona de resistencia de consolidación anterior) ● 4538 (resistencia de retroceso de Fibonacci del 23,6%) ● 4565 (fuerte resistencia del 4H MA20) 🟢 Niveles de soporte ● 4480–4465 (zona de soporte a corto plazo) ● 4439 (segundo nivel de soporte de 4H) ● 4400 (soporte psicológico de números redondos) ✅ Referencia de estrategia comercial 🔰 Estrategia de venta (posiciones cortas que siguen la tendencia) 👉 Zona de entrada: 4520 – 4535 🎯 Objetivos: 4465 → 4439 → 4400 📍 Lógica: ● Tanto el sistema de media móvil de 4 horas como el de 1 hora han vuelto a una alineación bajista. ● 4538 sirve como nivel clave de resistencia de Fibonacci. 🔰 Estrategia de compra (sobreventa de rebote a corto plazo) 👉 Zona de entrada: 4480 – 4465 🎯 Objetivos: 4488 → 4505 → 4524 📍 Lógica: ● El área cercana a 4465 representa una zona de sobreventa a corto plazo. ● Sin embargo, la tendencia general sigue siendo bajista, por lo que las posiciones largas sólo son adecuadas para operaciones ligeras a corto plazo. ⚠️ Perspectiva de tendencia 👉 Si el precio logra recuperarse y mantenerse por encima de 4538: el mercado puede entrar en una fase de recuperación a corto plazo, con objetivos al alza hacia 4582/4619. 👉 Si el precio cae por debajo de 4465: el impulso bajista podría acelerarse aún más, con objetivos a la baja hacia 4439/4400. 👉 Si el precio se mantiene dentro del rango 4465-4538 rango: lo más probable es que el mercado continúe con una débil consolidación de bajo nivel, y la estrategia general aún debería centrarse en vender los repuntes. 🔔 Si este análisis le resulta útil, apóyeme dando me gusta y comentando, lo que me animará a compartir más contenido de alta calidad. Además, siéntase libre de compartir sus opiniones sobre el futuro movimiento de precios de este gráfico.