
gizmodotech71d ago
VHS-Inspired ‘Cyberpunk 2077’ Mod Takes Night City Back to the Future
Sometimes looking less realistic can mean feeling more realistic.
#TECH
Sometimes looking less realistic can mean feeling more realistic.

These operational improvements are expected to support sustained revenue generation in the coming months. The post NNPC Remits ₦1.8trn To FG, Revenue Hits ₦2.68tn appeared first on Channels Television .

If supplies from the Persian Gulf remain blocked, oil prices are expected to rise again. Experts also believe that prices are unlikely to decline much further than what they experienced this week. Oil prices had experienced their sharpest decline since 2020 earlier this week in response to the two-week ceasefire agreement between the US and Iran. “If the strait reopens, a price decline would be expected. However, prices are unlikely to fall significantly below this week’s low,” Carsten Fritsch, commodity analyst at Commerzbank AG, said. Transit risks and new fees impede strait reopening Experts said that prices have a risk premium because of the uncertainty about the safety of vessels that would transit the Strait of Hormuz even if it...
As the 2026 tax cycle comes to a close with the April 15 deadline approaching, thousands of parents may be eligible to claim up to $6,700 by combining adoption and child tax credits

Weekly economic indicators stay broadly positive: strong yield curves, credit spreads and spending, with mixed real economy signals. Click for more.

One of Minnesota’s best-known market analysts, Jim Paulsen, outlines a case for greater risk and lower interest rates.

Congress returns from its spring break the week of April 13 and the need for stable long-term funding TSA and air traffic employees remain.
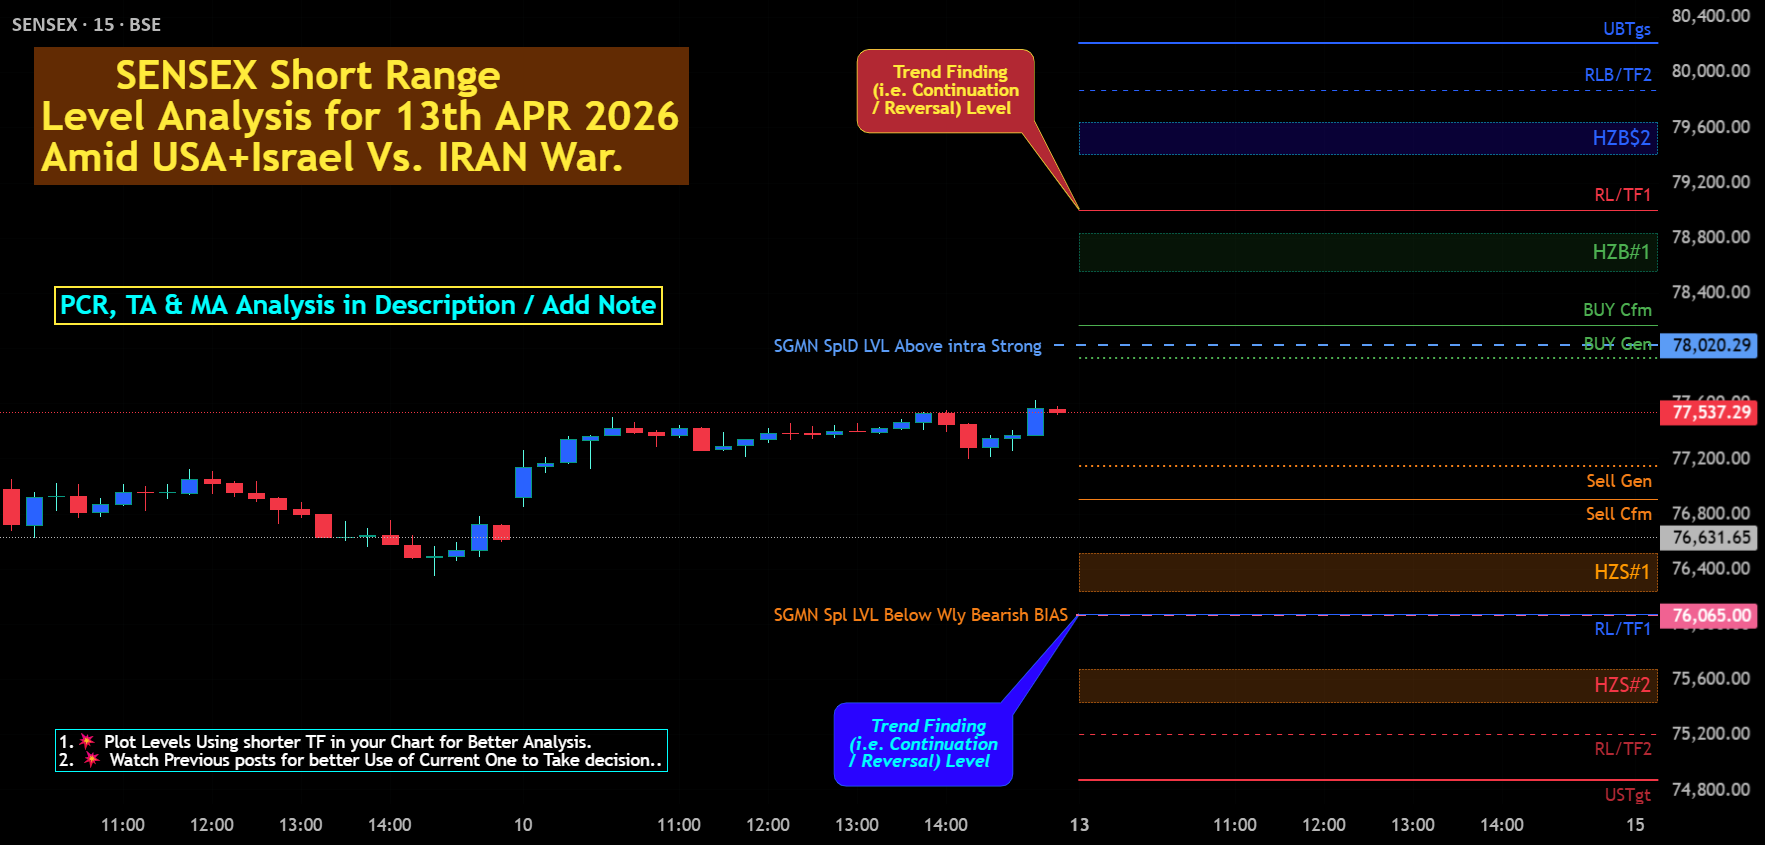
SGMN Spl D LVL Above intra Strong=> 78020.29 SGMN Spl LVL Below Wly Bearish BIAS=> 76065 Trade Cautiously as 14th Apr 2026 is HOLIDAY & Amid USA+Israel Vs. IRAN War CONFLICTED high frequency announcement. ━━━🟡🟢🔵 PCR Data Analysis🔵🟢🟡━━━ 🟡 2nd Weekly EXP (09th Apr 2026) PCR Weekly Basis Analysis => Put OI: 5,08,435, Call OI: 3,67,461, PCR: 1.38. Trend Strength: 🟢 Bullish with 🟢Bullish Sentiment. Intraday Change in Weekly Basis Data => Put OI Change: 3,35,164, Call OI Change: 1,75,942, Change OI PCR: 1.90. Trend Strength: 🟢 Bullish with 🟢Bullish Sentiment. 🟣 Monthly EXP.(30th APR 2026) PCR Analysis: Put OI:20,760, Call OI: 21,514, PCR: 0.96. Trend Strength: 🟠 Neutral with 🟠 Neutral Sentiment Intraday Change in Monthly Basis Data => Put OI Change: -106, Call OI Change: 789, Change OI PCR: -0.13. Trend Strength: 🟠 Neutral with 🛑 Bearish Sentiment 🔔 Notice one thing Monthly -VE PUT OI Change Where as +ve CALL OI Change=> Sidewise to Bearish BIAS. ━━━🟡🟢🔵Some Technical Parameter:🔵🟢🟡━━━ 🛑 VWap vs Price: Price Below. 🟢 RSI(14): 53.74. (Bullish) 🟢 Stoch Bias(14): 98.81, 67.35(UP but Overbought) 🟢 MACD Bias (12,26): 679.29, -901.24, -1580.52. (BULLISH) 🟡 Williams %R: -1.40.(Perfect Reversal Point Near -80) 🟢 ROC: 1.10 Time Frame basis Trend: 🟢Bullish: 1 Min, 5 Min, 15 Min, 30 Min, 1 Hour, 2 Hour, 4 Hour, Monthly. 🛑Bearish: Daily, Weekly. ━━━🟡🟢🔵 MA (Moving Average) Analysis 🔵🟢🟡━━━ All major Averages are Above Index Value. ⚫ Period ⚪SMA ⚪EMA 🟩 MA 9 - 74716.99 - 75622.52 🟩 MA 20 - 74948.56 - 75894.75 🟥 MA 50 - 79260.74 - 78289.39 🟥 MA 100 - 81925.77 - 80215.78 🟥 MA 200 - 82067.39 - 80924.67 ━━━━━🟥🟧🟨🟩🟦🟪⬛━━━━━ 💥Level Interpretation / description: ✍🏻L#1: If the candle crossed & stays above the “Buy Gen”, it is treated / considered as Bullish bias. Cfm=> Confirmation. L#2: Possibility / Probability of REVERSAL near 🔕RL/TF1 & 🔔RL/TF2 L#3: If the candle stays above “Sell Gen” but below “Buy Gen”, it is treated / considered as Sidewise. Aggressive Traders can take Long position near “Sell Gen” either retesting or crossed from Below & vice-versa i.e. can take Short position near “Buy Gen” either retesting or crossed downward from Above. L#4: If the candle crossed & stays below the “Sell Gen”, it is treated / considered a Bearish bias. L#5: Possibility / Probability of REVERSAL near 🔕RL/TF1 & 🔔RL/TF2 HZB (Buy side) & HZS (Sell side) => Hurdle Zone, ✍🏻 *** Specialty of “HZB#1, HZB#2 HZS#1 & HZS#2” is Sidewise (behaviour in Nature) Rest Plotted and Mentioned on Chart Color code Used: Green, BLUE =. Positive bias. Safron, RED =. Negative bias. RED in Between Green means Trend Finder / Momentum Change / CYCLE Change and Vice Versa. Notice One thing: HOW LEVELS are Working. Use any Momentum Indicator / Oscillator or as you "USED to" to Take entry. ━━━━━🟥🟧🟨🟩🟦🟪⬛━━━━━ ⚠️ DISCLAIMER: The information, views, and ideas shared here are purely for educational and informational purposes only. They are not intended as investment advice or a recommendation to buy, sell, or hold any financial instruments. I am not a SEBI-registered financial adviser. Trading and investing in the stock market involves risk, and you should do your own research and analysis. You are solely responsible for any decisions made based on this research. "🔔As HARD EARNED MONEY IS YOUR's, So DECISION SHOULD HAVE TO BE YOUR's". ━━━━━🟥🟧🟨🟩🟦🟪⬛━━━━━ ❇️ Follow notification about periodical View 💥 Do Comment for Stock WEEKLY Level Analysis.🚀 📊 Do you agree with this view? ✈️ HIT THE PLANE ICON if this technical observation resonates with you. It will Motivate me. ━━━━━🟥🟧🟨🟩🟦🟪⬛━━━━━ 💡 If You LOOKING any CHART & want for Level and ANALYZE? Share your desired stock names in the comments below! I will try to analyze the chart Levels, patterns and share my technical view (so far my Knowledge). If Viewers think It can identify meaningful setups. Looking forward to hearing from all of you — let's keep this discussion going and help each other make better trading decisions. ___________🔕^^^⚫⚪^🙏🏼🙏🏼🙏🏼^⚪⚫^^^🔔___________

Muscat: Industrial companies listed on the Muscat Stock Exchange recorded a positive performance during the week, coinciding with the start of the...


LOS ANGELES — The economic fallout from the war with Iran is driving up the cost of buying a home, even as other housing market trends in many parts of the country favor home shoppers this spring.

InvestingPro’s fair value flagged TARC as overvalued before 48% drop