in_tradingview51d ago
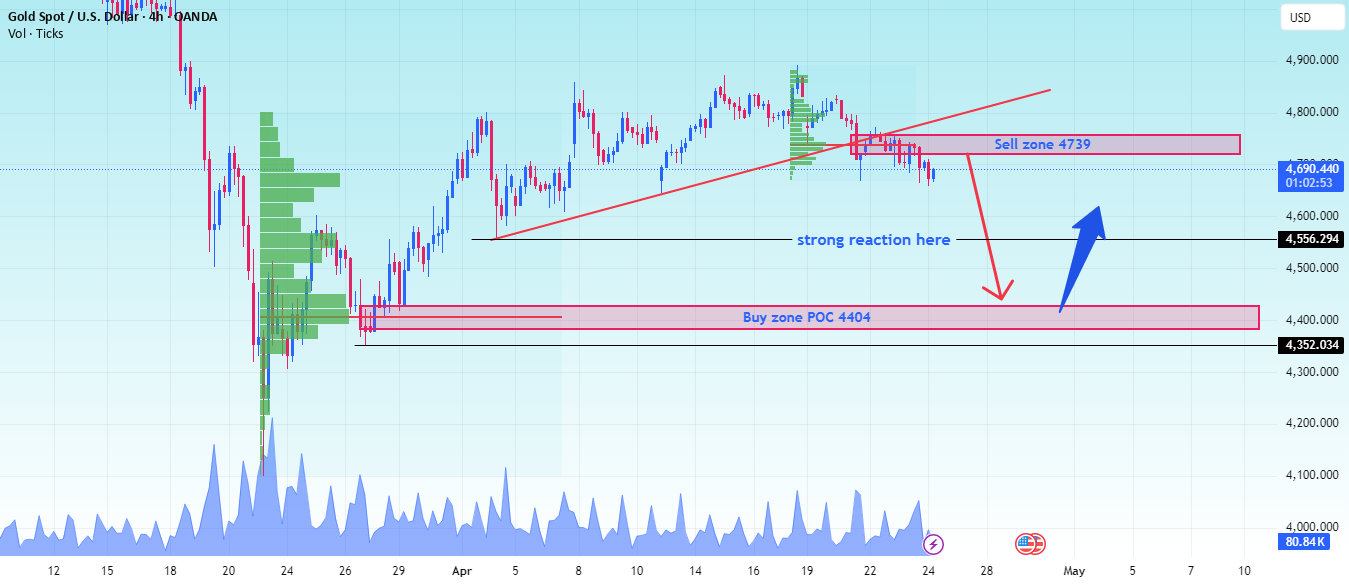
Gold Slips Below Trendline as 4739 Sell Zone Caps Recovery Gold is showing increasing technical weakness on the 4H chart as price trades below the former rising trendline and continues to struggle under the 4739 sell zone. The current structure suggests that upside momentum is fading, while the market begins to lean toward a deeper corrective move. Technical Structure From a technical perspective, gold has broken away from the previous buying path after losing support from the ascending trendline. Since that breakdown, price has remained heavy and continues to rotate below the nearby resistance zone. The 4739 area is now acting as a clear sell zone. Recent price action failed to reclaim this level, confirming that supply is still active and that buyers are not yet strong enough to rebuild momentum above resistance. Volume profile also adds weight to the current bearish bias. The chart shows that price is moving away from the upper value area, while the lower high structure remains visible on the right side of the chart. This reflects fading bullish participation and a market that is gradually accepting lower prices. As long as gold stays below the broken trendline and below 4739, the technical structure remains vulnerable to further downside expansion. Key Levels Sell zone / resistance: 4739 Broken dynamic support: Former ascending trendline Major reaction support: 4556 Buy zone / POC: 4404 Lower structural support: 4352 Scenario & Expectation The preferred scenario remains bearish continuation. As long as price stays below 4739, gold may continue extending lower toward 4556, which is the first important reaction zone on the chart. If selling pressure remains firm and that support fails to hold, the market could move deeper into the 4404 buy zone, where the volume profile suggests stronger interest may return. The 4352 level remains the deeper structural support if the correction extends further. On the other hand, if price reclaims 4739 and starts holding above it with stronger acceptance, the immediate bearish pressure would weaken and the structure would need to be reassessed. Conclusion Gold is currently trading in a weaker technical position after losing its rising trendline and failing to recover above the 4739 sell zone. With price now shifting away from resistance and structure turning heavier on the 4H chart, the market continues to favor a move toward lower support and liquidity zones, with 4556 and 4404 standing out as the key downside references.