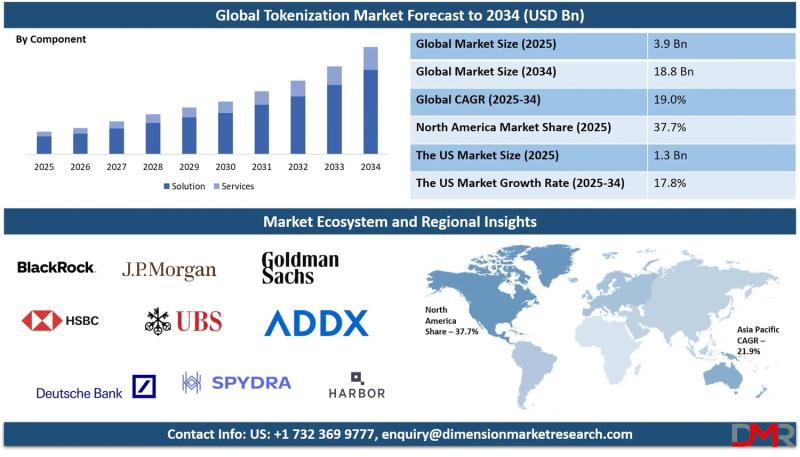
Panel

Noticias Financieras

Negociación con Ghana Amalgamated Trust Albatross en dos bancos autóctonos
thebftonlinehace 33d

Negociación con Ghana Amalgamated Trust Albatross en dos bancos autóctonos

Por el Dr. Richmond Akwasi ATUAHENE El Ghana Amalgamated Trust se había convertido en un lastre para los bancos autóctonos que participaron en el vehículo de propósito especial porque el financiamiento con altos intereses costaba un 19,1 por ciento anual, lo que había creado dependencia en lugar de sostenibilidad y preocupaba la viabilidad a largo plazo de los dos bancos autóctonos. Si bien estaba destinado a [...] La publicación Tratando con Ghana Amalgamated Trust Albatross en dos bancos indígenas apareció por primera vez en The Business & Financial Times.

#ECONOMY
Tres escenarios para la economía global y la crisis de Irán
hellenicshippingnewshace 33d

Tres escenarios para la economía global y la crisis de Irán

Mientras el negocio petroquímico lucha con su peor crisis histórica, que ya se prolonga durante más de cuatro años, los ataques de Estados Unidos e Israel contra Irán representan una amenaza renovada para la industria. Esto se debe a una serie de efectos sobre el Estrecho de Ormuz y los precios del petróleo, como siempre en el mejor, medio y peor caso,...

#ECONOMY
en_prnasisahace 33d

Dingdong (Cayman) Limited anuncia los resultados financieros del cuarto trimestre de 2025

SHANGHAI, March 4, 2026 /PRNewswire/ -- Dingdong (Cayman) Limited ("Dingdong" or the "Company") (NYSE: DDL), a leading fresh grocery e-commerce company in China, with advanced supply chain capabilities, today announced its unaudited financial results for the quarter ended December 31, 2025. Fourth Quarter 2025 Highlights: GMV for the fourth quarter of 2025 increased by 2.4% year over year to RMB6,703.2 million (US$943.0 million) from RMB6,546.6 million in the same quarter of 2024, positive year-on-year growth for eight straight quarters. Revenue for the fourth quarter of 2025 increased by 5.7% year over year to RMB6,242.6 million (US$892.7 million) from RMB5,905.0 million in the same quarter of 2024, positive year-on-year growth for eight straight quarters. Total number of orders increased by 3.4% year over year in the fourth quarter of 2025. Net income for the fourth quarter of 2025 was RMB33.6 million (US$4.8 million), the eighth consecutive quarter of profitability. Non-GAAP net income for the fourth quarter of 2025 was RMB50.8 million (US$7.3 million), the thirteenth consecutive quarter of non-GAAP profitability. Mr. Changlin Liang, Founder and Chief Executive Officer of Dingdong, stated, "As of the fourth quarter of 2025, Dingdong has maintained profitability under non-GAAP standards for thirteen consecutive quarters and under GAAP standards for eight consecutive quarters. Also the Company has delivered year-over-year revenue growth for the eighth consecutive quarter. This consistent top-line expansion, together with the steady delivery of profitability objectives, fully underscores Dingdong's strategic resilience and strong execution capabilities amid the complex and competitive market environment. It also provides solid fundamentals and strong momentum to advance our long-term strategic initiatives." Mr. Song Wang, Chief Financial Officer of Dingdong, stated, "In the fourth quarter of 2025, Dingdong reported revenue of RMB6.24 billion, marking a 5.7% year-on-year growth and maintaining positive growth for eight straight quarters. Non-GAAP net profit reached RMB50.8 million with a 0.8% net profit margin, while GAAP net profit was RMB33.6 million with a 0.5% margin. We had net operating cash inflow of RMB0.20 billion in the fourth quarter of 2025, the tenth consecutive quarter of positive cash flow. By the end of the fourth quarter, after deducting short-term borrowings, our actual cash owned increased to RMB3.14 billion, the tenth consecutive quarter of sustained growth." Fourth Quarter 2025 Financial Results Total revenues were RMB6,242.6 million (US$892.7 million) compared with total revenues of RMB5,905.0 million in the same quarter of 2024, increased by 5.7% year over year, primarily due to the rise of number of orders resulting from rise in the average monthly number of transacting users and higher monthly order frequency, and new opened frontline fulfillment stations with density and market penetration improved in East China. Additionally, our B2B revenue achieved year-over-year growth, with the revenue contribution from overseas B2B operations continuing to increase and posting rapid quarter-over-quarter growth. The increase was offset by the impact of the price decline in CPI for certain major categories in our business, such as pork, in the fourth quarter of 2025. Product Revenues were RMB6,164.6 million (US$881.5 million) compared with product revenues of RMB5,822.5 million in the same quarter of 2024, increased by 5.9% year over year. Service Revenues were RMB78.0 million (US$11.2 million) compared with service revenues of RMB82.5 million in the same quarter of 2024, decreased by 5.4% year over year. Total operating costs and expenses were RMB6,252.5 million (US$894.1 million) compared with RMB5,848.0 million in the same quarter of 2024, with a detailed breakdown as below: Cost of goods sold was RMB4,415.9 million (US$631.5 million), an increase of 7.2% from RMB4,120.8 million in the same quarter of 2024. Cost of goods sold as a percentage of revenues increased to 70.7% from 69.8% in the same quarter of 2024. Gross margin decreased to 29.3% from 30.2% in the same quarter of 2024. Since the launch and continued implementation of the 4G Strategy in early 2025, the gross margin for the fourth quarter of 2025 was generally consistent with that of previous quarters, but decreased compared with the same period of the prior year. Fulfillment expenses were RMB1,350.9 million (US$193.2 million), an increase of 5.6% from RMB1,278.9 million in the same quarter of 2024. Fulfillment expenses as a percentage of total revenues slightly decreased to 21.6% from 21.7% in the same quarter of 2024. Sales and marketing expenses were RMB136.7 million (US$19.5 million), a decrease of 0.6% from RMB137.5 million in the same quarter of 2024. Sales and marketing expenses as a percentage of total revenues decreased to 2.2% from 2.3% in the same quarter of 2024. The year-on-year decrease in marketing expenses is attributable to the positive results achieved by the 4G strategy rolled out in the first three quarters. The company has further focused on the operation strategy of leveraging the organic traffic of high-quality products, reduced investment in inefficient marketing activities, and thus improved the input-output efficiency of marketing expenses. General and administrative expenses were RMB130.3 million (US$18.6 million), an increase of 19.3% from RMB109.2 million in the same quarter of 2024, mainly driven by staff costs, specifically from the new "Dong Li Sheng" management trainees. Product development expenses were RMB218.7 million (US$31.3 million), an increase of 8.5% from RMB201.6 million in the same quarter of 2024. While advocating for energy and resource saving, we will continue to invest in our product development capabilities, agricultural technology, data algorithms, and other technology infrastructure such as the AI technical capability, to further enhance our competitiveness. Net income from operations was RMB12.0 million (US$1.7 million), compared with net income from operations of RMB61.5 million in the same quarter of 2024. Non-GAAP income from operations, which is a non-GAAP measure for loss from operations that excludes share-based compensation expenses, was RMB29.1 million (US$4.2 million), compared with Non-GAAP income from operations of RMB86.6 million in the same quarter of 2024. Net income was RMB33.6 million (US$4.8 million), compared with net income of RMB91.6 million in the same quarter of 2024. Non-GAAP net income, which is a non-GAAP measure that excludes share-based compensation expenses, was RMB50.8 million (US$7.3 million), compared with non-GAAP net income of RMB116.7 million in the same quarter of 2024. In addition, non-GAAP net income margin, which is the Company's non-GAAP net income as a percentage of total revenues, was 0.8% compared with 2.0% in the same quarter of 2024. Basic and diluted net income per share were RMB0.10 (US$0.01) and RMB0.09 (US$0.01), compared with net income per share of RMB0.27 and RMB0.26 in the same quarter of 2024. Non-GAAP net income per share, basic and diluted, were RMB0.15 (US$0.02) and RMB0.14 (US$0.02), compared with RMB0.35 and RMB0.33 in the same quarter of 2024. Cash and cash equivalents, restricted cash and short-term investments were RMB3,976.8 million (US$568.7 million) as of December 31, 2025, compared with RMB3,908.2 million as of September 30, 2025. We have been working diligently to optimize our capital usage and financing structure. The cash and cash equivalents, restricted cash, short-term investments and long-term deposits as included in the other non-current assets deducting the balance of short-term borrowings, is RMB3.14 billion, a net increase for the tenth consecutive quarter, compared with RMB3.03 billion as of September 30, 2025. The Definitive Agreement with Meituan On February 5, 2026, the Company announced the entry into a definitive agreement to sell its China business to Meituan. On February 10, 2026, the Company further announced its intention to utilize a substantial majority of the proceeds from the sale of its China operations for share repurchase plans and/or dividends upon the closing of the transaction, as well as other material terms of the transaction. For details, please refer to the Company's previous press releases. About Dingdong (Cayman) Limited We are a leading fresh grocery e-commerce company in mainland China, with sustainable long-term growth. We directly provide users and households with fresh groceries, prepared food, and other food products through delivering a convenient and excellent shopping experience supported by an extensive self-operated frontline fulfillment grid. Leveraging our deep insights into consumers' evolving needs and our strong food innovation capabilities, we have successfully launched a series of private label products spanning a variety of food categories. Many of our private label products are produced at our Dingdong production plants, allowing us to more efficiently produce and offer safe and high-quality food products. We aim to be the first choice for fresh and food shopping. For more information, please visit: https://ir.100.me. Use of Non-GAAP Financial Measures The Company uses non-GAAP measures, such as non-GAAP net income, non-GAAP net income margin, non-GAAP net income attributable to ordinary shareholders and non-GAAP net income per share, basic and diluted, in evaluating its operating results and for financial and operational decision-making purposes. The Company believes that the non-GAAP financial measures help identify underlying trends in its business by excluding the impact of share-based compensation expenses, which are non-cash charges and do not correlate to any operating activity trends. The Company believes that the non-GAAP financial measures provide useful information about the Company's results of operations, enhance the overall understanding of the Company's past performance and future prospects and allow for greater visibility with respect to key metrics used by the Company's management in its financial and operational decision-making. The non-GAAP financial measures are not defined under U.S. GAAP and are not presented in accordance with U.S. GAAP. The non-GAAP financial measures have limitations as analytical tools, and when assessing the Company's operating performance, cash flows or liquidity, investors should not consider them in isolation, or as a substitute for net loss, cash flows provided by operating activities or other consolidated statements of operations and cash flows data prepared in accordance with U.S. GAAP. The Company's definition of non-GAAP financial measures may differ from those of industry peers and may not be comparable with their non-GAAP financial measures. The Company mitigates these limitations by reconciling the non-GAAP financial measures to the most comparable U.S. GAAP performance measures, all of which should be considered when evaluating the Company's performance. For more information on the non-GAAP financial measures, please see the table captioned "Unaudited Reconciliation of GAAP and Non-GAAP Results" set forth at the end of this announcement. Exchange Rate Information This announcement contains translations of certain RMB amounts into U.S. dollars ("US$") at specified rates solely for the convenience of the reader. Unless otherwise stated, all translations from RMB to US$ were made at the rate of RMB6.9931 to US$1.00, the exchange rate on December 31, 2025 set forth in the H.10 statistical release of the Federal Reserve Board. The Company makes no representation that the RMB or US$ amounts referred could be converted into US$ or RMB, as the case may be, at any particular rate or at all. Safe Harbor Statement This announcement contains forward-looking statements. These statements are made under the "safe harbor" provisions of the U.S. Private Securities Litigation Reform Act of 1995. These forward-looking statements can be identified by terminology such as "will," "expects," "anticipates," "aims," "future," "intends," "plans," "believes," "estimates," "confident," "potential," "continue," or other similar expressions. Among other things, business outlook and quotations from management in this announcement, as well as Dingdong's strategic and operational plans, contain forward-looking statements. Dingdong may also make written or oral forward-looking statements in its periodic reports to the U.S. Securities and Exchange Commission (the "SEC"), in its interim and annual reports to shareholders, in press releases and other written materials and in oral statements made by its officers, directors or employees to third parties. Statements that are not historical facts, including but not limited to statements about Dingdong's beliefs and expectations, are forward-looking statements. Forward-looking statements involve inherent risks and uncertainties. A number of factors could cause actual results to differ materially from those contained in any forward-looking statement, including but not limited to the following: Dingdong's goals and strategies; Dingdong's future business development, financial conditions, and results of operations; the expected outlook of the fresh grocery ecommerce market in China; Dingdong's expectations regarding demand for and market acceptance of its products and services; Dingdong's expectations regarding its relationships with its users, clients, business partners, and other stakeholders; competition in Dingdong's industry; and relevant government policies and regulations relating to Dingdong's industry, and general economic and business conditions globally and in China and assumptions underlying or related to any of the foregoing. Further information regarding these and other risks is included in the Company's filings with the SEC. All information provided in this announcement and in the attachments is as of the date of the announcement, and the Company undertakes no duty to update such information, except as required under applicable law. DINGDONG (CAYMAN) LIMITED UNAUDITED CONDENSED CONSOLIDATED BALANCE SHEETS (Amounts in thousands of RMB and US$) As of December 31,2024 December 31,2025 December 31,2025 RMB RMB US$ (Unaudited) ASSETS Current assets: Cash and cash equivalents 887,427 1,106,795 158,270 Restricted cash 2,788 340 49 Short-term investments 3,561,977 2,869,681 410,359 Accounts receivable, net 125,896 191,939 27,447 Inventories, net 553,601 570,485 81,578 Advance to suppliers 62,730 114,105 16,317 Prepayments and other current assets 170,753 186,744 26,704 Total current assets 5,365,172 5,040,089 720,724 Non-current assets: Property and equipment, net 176,290 232,757 33,284 Operating lease right-of-use assets 1,464,791 1,580,099 225,951 Other non-current assets 111,395 163,223 23,341 Total non-current assets 1,752,476 1,976,079 282,576 TOTAL ASSETS 7,117,648 7,016,168 1,003,300 LIABILITIES, MEZZANINE EQUITY AND SHAREHOLDERS' EQUITY Current liabilities: Accounts payable 1,660,472 1,920,341 274,605 Customer advances and deferred revenue 279,276 273,260 39,076 Accrued expenses and other current liabilities 767,080 760,613 108,766 Salary and welfare payable 317,152 304,531 43,547 Operating lease liabilities, current 640,245 664,304 94,994 Short-term borrowings 1,606,253 871,520 124,626 Total current liabilities 5,270,478 4,794,569 685,614 Non-current liabilities: Operating lease liabilities, non-current 780,036 897,811 128,385 Other non-current liabilities 143,118 147,573 21,103 Total non-current liabilities 923,154 1,045,384 149,488 TOTAL LIABILITIES 6,193,632 5,839,953 835,102 DINGDONG (CAYMAN) LIMITED UNAUDITED CONDENSED CONSOLIDATED BALANCE SHEETS (CONTINUED) (Amounts in thousands of RMB and US$) As of December 31, 2024 December 31, 2025 December 31, 2025 RMB RMB US$ (Unaudited) LIABILITIES, MEZZANINE EQUITY AND SHAREHOLDERS' EQUITY (CONTINUED) Mezzanine Equity: Redeemable noncontrolling interests 125,405 135,435 19,367 TOTAL MEZZANINE EQUITY 125,405 135,435 19,367 Shareholders' equity: Ordinary shares 4 4 1 Additional paid-in capital 14,181,030 14,260,014 2,039,155 Treasury stock (51,176) (59,969) (8,575) Accumulated deficit (13,384,881) (13,163,217) (1,882,315) Accumulated other comprehensive income 53,634 3,948 565 TOTAL SHAREHOLDERS' EQUITY 798,611 1,040,780 148,831 TOTAL LIABILITIES, MEZZANINE EQUITY AND SHAREHOLDERS' EQUITY 7,117,648 7,016,168 1,003,300 DINGDONG (CAYMAN) LIMITED UNAUDITED CONDENSED CONSOLIDATED STATEMENTS OF COMPREHENSIVE INCOME (Amounts in thousands of RMB and US$, except for number of shares and per share data) For the three months ended December 31, 2024 2025 2025 RMB RMB US$ (Unaudited) Revenues: Product revenues 5,822,527 6,164,574 881,522 Service revenues 82,495 78,010 11,155 Total revenues 5,905,022 6,242,584 892,677 Operating costs and expenses: Cost of goods sold (4,120,793) (4,415,876) (631,462) Fulfillment expenses (1,278,904) (1,350,900) (193,176) Sales and marketing expenses (137,513) (136,662) (19,542) Product development expenses (201,632) (218,731) (31,278) General and administrative expenses (109,195) (130,303) (18,633) Total operating costs and expenses (5,848,037) (6,252,472) (894,091) Other operating income, net 4,534 21,873 3,128 Income from operations 61,519 11,985 1,714 Interest income 37,879 27,345 3,910 Interest expenses (6,852) (2,836) (406) Other income/(expenses), net 2,875 (913) (131) Income before income tax 95,421 35,581 5,087 Income tax expenses (3,830) (1,980) (283) Net income 91,591 33,601 4,804 Accretion of redeemable noncontrolling interests (2,409) (2,602) (372) Net income attributable to ordinary shareholders 89,182 30,999 4,432 DINGDONG (CAYMAN) LIMITED UNAUDITED CONDENSED CONSOLIDATED STATEMENTS OF COMPREHENSIVE INCOME (CONTINUED) (Amounts in thousands of RMB and US$, except for number of shares and per share data) For the three months ended December 31, 2024 2025 2025 RMB RMB US$ (Unaudited) Net income per Class A and Class B ordinary share: Basic 0.27 0.10 0.01 Diluted 0.26 0.09 0.01 Shares used in net income per Class A and Class B ordinary share computation: Basic 324,500,919 324,832,508 324,832,508 Diluted 337,933,639 336,937,358 336,937,358 Other comprehensive loss, net of tax of nil: Foreign currency translation adjustments 55,517 (23,784) (3,401) Comprehensive income 147,108 9,817 1,403 Accretion of redeemable noncontrolling interests (2,409) (2,602) (372) Comprehensive income attributable to ordinary shareholders 144,699 7,215 1,031 DINGDONG (CAYMAN) LIMITED UNAUDITED CONDENSED CONSOLIDATED STATEMENTS OF CASH FLOWS (Amounts in thousands of RMB and US$) For the three months ended December 31, 2024 2025 2025 RMB RMB US$ (Unaudited) Net cash generated from operating activities 190,878 204,469 29,239 Net cash (used in)/generated from investing activities (158,850) 125,524 17,950 Net cash used in financing activities (49,678) (53,242) (7,614) Effect of exchange rate changes on cash and cash equivalents and restricted cash 3,425 (2,535) (362) Net (decrease)/increase in cash and cash equivalents and restricted cash (14,225) 274,216 39,213 Cash and cash equivalents and restricted cash at the beginning of the period 904,440 832,919 119,106 Cash and cash equivalents and restricted cash at the end of the period 890,215 1,107,135 158,319 DINGDONG (CAYMAN) LIMITED UNAUDITED RECONCILIATION OF GAAP AND NON-GAAP RESULTS (Amounts in thousands of RMB and US$, except for number of shares and per share data) For the three months endedDecember 31, 2024 2025 2025 RMB RMB US$ (Unaudited) Income from operations 61,519 11,985 1,714 Add: share-based compensation expenses (1) 25,073 17,157 2,454 Non-GAAP income from operations 86,592 29,142 4,168 Operating margin 1.1 % 0.2 % 0.2 % Add: share-based compensation expenses 0.4 % 0.3 % 0.3 % Non-GAAP operating margin 1.5 % 0.5 % 0.5 % Net income 91,591 33,601 4,804 Add: share-based compensation expenses (1) 25,073 17,157 2,454 Non-GAAP net income 116,664 50,758 7,258 Net income margin 1.6 % 0.5 % 0.5 % Add: share-based compensation expenses 0.4 % 0.3 % 0.3 % Non-GAAP net income margin 2.0 % 0.8 % 0.8 % Net income attributable to ordinary shareholders 89,182 30,999 4,432 Add: share-based compensation expenses (1) 25,073 17,157 2,454 Non-GAAP net income attributable to ordinary shareholders 114,255 48,156 6,886 Net income per Class A and Class B ordinary share: Basic 0.27 0.10 0.01 Diluted 0.26 0.09 0.01 Add: share-based compensation expenses Basic 0.08 0.05 0.01 Diluted 0.07 0.05 0.01 Non-GAAP net income per Class A and Class B ordinary share: Basic 0.35 0.15 0.02 Diluted 0.33 0.14 0.02 (1) Share-based compensation expenses are recognized as follows: For the three months ended December 31, 2024 2025 2025 RMB RMB US$ (Unaudited) Fulfillment expenses 4,148 2,416 345 Sales and marketing expenses 1,520 2,376 340 Product development expenses 12,468 5,746 822 General and administrative expenses 6,937 6,619 947 Total 25,073 17,157 2,454

#STOCKS
Perspectiva de marzo de 2026
seekingalphahace 33d

Perspectiva de marzo de 2026

Después de un comienzo de año relativamente positivo y tranquilo en enero, febrero resultó ser mucho más agitado en los mercados y la economía. Lea más aquí.

#STOCKS
benzingahace 33d

National Vision Holdings, Inc. informa los resultados financieros del cuarto trimestre y del año fiscal 2025

2025 Results Mark a Year of Strong Momentum Fueled by Strategic Transformation, Cost DisciplineExpansion Into Targeted Customer Cohorts Drove Enhanced Profitability, Positioning Company for Sustained GrowthProvides 2026 GuidanceFourth quarter 2025 highlights compared to fourth quarter 2024*:Net revenue from continuing operations of $503.4 million, increased 15.1%Comparable store sales growth of 6.6% and Adjusted Comparable Store Sales Growth of 4.8%, represented 12 consecutive quarters of positive growthNet income from continuing operations of $3.3 million, Diluted EPS from continuing operations of $0.04, with Income (loss) from continuing operations margin improving to 0.7% from (6.7)%Adjusted Operating Income from continuing operations increased to $17.6 million from $3.2 million, with Adjusted Operating Margin improving to 3.5% from 0.7%Adjusted Diluted EPS from continuing operations of $0.15 compared with $(0.04)Fiscal 2025 highlights compared to fiscal year 2024*:Net revenue from continuing operations of $1,987.5 million, an increase of 9.0%Comparable store sales growth of 5.9% and Adjusted Comparable Store Sales Growth of 6.0%Net income from continuing operations of $29.6 million and Diluted EPS from continuing operations of $0.37, with Income (loss) from continuing operations margin improving to 1.5% from (1.5)%Adjusted Operating Income from continuing operations of $102.5 million compared with $65.5 million in fiscal year 2024, with Adjusted Operating Margin improving to 5.2% from 3.6%Adjusted Diluted EPS from continuing operations increased to $0.80 compared with $0.52 in fiscal year 2024National Vision Holdings, Inc. (NASDAQ:EYE) ("National Vision" or the "Company") today reported its financial results for the fourth quarter and fiscal year ended January 3, 2026, and is providing its outlook for fiscal 2026.Alex Wilkes, National Vision's CEO, said, "2025 was a remarkable year for National Vision – one in which we embarked on a bold reinvention of our company and executed our plan with discipline and precision, achieving results that surpassed our own expectations. Our strong fourth‐quarter performance reflects the meaningful progress we are making across the business. Importantly, this year we saw strong traffic gains from our most profitable target customers, including those who use managed vision care insurance, progressive lens wearers and those who bring in outside prescriptions. We are elevating our product assortment, enhancing the patient and customer experience, modernizing marketing, and expanding with a higher value customer, while remaining committed to our position as a value leader. Operating margin expansion has been a clear priority for this team, and we're delivering on that commitment. This progress reflects our intentional management of our customer mix, a disciplined approach on cost management, along with the thoughtful investments we've made to strengthen the long‐term health of the business."Mr. Wilkes continued, "As we head into the new year, I'm incredibly confident in our trajectory, which reflects the aspirations we shared at our investor day. We have the right ambition, the right strategy, and the right team to continue generating sustained value for our shareholders."*Note: National Vision's results for the fourth quarter and full fiscal year ended January 3, 2026 ("fiscal 2025"), contain an additional, non-comparable week, or the "53rd week", when compared to the fourth quarter and full year results for the respective 13- and 52- week periods ended December 28, 2024. The 53rd week added $35.6 million to net revenue, approximately $0.03 to diluted EPS, $2.4 million to Net Income, and $3.5 million to Adjusted Operating Income for the quarter and the year. The 53rd week is not included in comparable store sales growth or Adjusted Comparable Store Sales Growth for the quarter or the year.This release includes certain Non-GAAP Financial Measures that are not recognized under generally accepted accounting principles ("GAAP"). Please see "Non-GAAP Financial Measures" and "Reconciliation of Non-GAAP to GAAP Financial Measures" below for more information.Results for all periods presented are reported on a continuing operations basis and reflect the results of our former Legacy segment and the substantial majority of AC Lens operations as discontinued operations. Unless otherwise noted, all comparisons are to the prior year period.Fourth Quarter 2025 Summary compared to Fourth Quarter 2024Net revenue increased 15.1% to $503.4 million, driven by the 53rd week, Adjusted Comparable Store Sales Growth, new store sales and partially offset by closed stores and a negative (0.8)% impact from the timing of unearned revenue.Comparable store sales growth was 6.6% and Adjusted Comparable Store Sales Growth was 4.8%, both reflecting a higher average ticket and continued strength in the managed care cohort, partially offset by self-pay customer traffic.The Company opened 12 new stores and closed four America's Best stores ending the quarter with 1,250 stores. Overall, store count grew 0.8%.Costs applicable to revenue increased 13.9% to $210.7 million. As a percentage of net revenue, costs applicable to revenue decreased 40 basis points to 41.9%, primarily due to the successful execution of pricing and product mix initiatives, partially offset by a slight increase in optometrist-related costs.Selling, general and administrative expenses (SG&A) increased 12.1% to $261.2 million. As a percentage of net revenue, SG&A decreased 140 basis points to 51.9%, primarily driven by operating leverage on lower payroll and expenses and fees, and advertising, partially offset by higher variable incentive compensation expenses related to revenue and profitability growth and higher health care expenses. Adjusted SG&A increased 11.2% to $251.9 million, a decrease of 180 basis points.Income (loss) from continuing operations, net of tax, increased to $3.3 million compared to $(29.4) million in the prior-year period. Income (loss) from continuing operations margin improved to 0.7% from (6.7)%.Diluted earnings per share (EPS) from continuing operations increased to $0.04, compared to $(0.37). Adjusted Diluted EPS increased to $0.15 from $(0.04). The net change in margin on unearned revenue negatively impacted both Diluted EPS and Adjusted Diluted EPS by $(0.02).Adjusted Operating Income increased 444.8% to $17.6 million. Adjusted Operating Margin improved to 3.5% from 0.7%. The net change in margin on unearned revenue negatively impacted income (loss) from continuing operations, by $(1.6) million and Adjusted Operating Income by $(2.1) million.Fiscal 2025 Summary compared to Fiscal 2024Net revenue increased 9.0% to $1,987.5 million driven by Adjusted Comparable Store Sales Growth, growth from new store sales, and the 53rd week, partially offset by the effect of closed stores and includes a negative (0.6)% impact from the timing of unearned revenue.Comparable store sales growth was 5.9% and Adjusted Comparable Store Sales Growth was 6.0%, primarily due to higher average ticket and continued strength in the managed care cohort, partially offset by a slight decrease in self-pay customer traffic.The Company opened 33 new stores, closed 12 America's Best stores and closed 11 Fred Meyer stores, ending the period with 1,250 stores. Overall, store count grew 0.8%.Costs applicable to revenue increased 7.3% to $819.5 million. As a percentage of net revenue, costs applicable to revenue decreased 70 basis points to 41.2%, primarily due to successful execution of pricing and product mix initiatives, partially offset by a decrease in contact lens product margin.SG&A increased 8.3% to $1,016.3 million. As a percentage of net revenue, SG&A decreased 40 basis points to 51.1% driven by operating leverage on lower expenses and fees, partially offset by higher variable incentive compensation expenses related to revenue and profitability growth and higher health care expenses. Adjusted SG&A increased 7.9% to $975.3 million and decreased 50 basis points to 49.1% of net revenue.Income (loss) from continuing operations increased to $29.6 million compared to $(27.2) million in the prior year period. Income (loss) from continuing operations margin increased to 1.5% compared to (1.5)%.Diluted EPS from continuing operations increased to $0.37 compared to $(0.35). Adjusted Diluted EPS increased to $0.80 compared to $0.52. The net change in margin on unearned revenue negatively impacted both Diluted EPS and Adjusted Diluted EPS by $(0.08).Adjusted Operating Income increased 56.5% to $102.5 million. Adjusted Operating Margin increased to 5.2% compared with 3.6%. The net change in margin on unearned revenue negatively impacted income (loss) from continuing operations, net of tax, by $(6.5) million and Adjusted Operating Income by $(8.7) million.Balance Sheet and Cash Flow HighlightsNational Vision's cash balance was $38.7 million as of January 3, 2026. The Company had no borrowings under its $300.0 million first lien revolving credit facility ("Revolving Loans"), exclusive of letters of credit of $6.7 million.Total debt was $245.9 million as of January 3, 2026, consisting of outstanding first lien term loans and finance lease obligations, net of unamortized discounts.National Vision entered into an interest rate swap during the fourth quarter of 2025 to help offset the variability of cash flows in term loan interest payments attributable to changes in Term SOFR. The notional amount of the hedge is $100.0 million.Share Repurchase ProgramOn January 3, 2026, the Company's previous share repurchase authorization expired with remaining capacity of $50 million. Effective March 2, 2026, the Company's board of directors authorized the Company to repurchase up to $50 million aggregate amount of shares of the Company's common stock until December 28, 2030. Repurchases of shares of common stock may be made through various methods, including, but not limited to, open market, privately negotiated, or accelerated share repurchase transactions. The timing, manner, price, and actual amount of share repurchases will be determined by management based on various factors, including, but not limited to, stock price, economic and market conditions, other capital management needs and opportunities, and corporate and regulatory considerations. The Company has no obligation to repurchase any amount of its common stock, and such repurchases, if any, may be suspended or discontinued at any time.Fiscal 2026 OutlookThe Company is providing the following outlook for the 52 weeks ending January 2, 2027. Fiscal 2026 OutlookNew Stores(1)~30-35Adjusted Comparable Store Sales Growth(2)3.0% - 6.0%Net Revenue$2.033 billion - $2.091 billionAdjusted Operating Income(2)$107 million - $133 millionAdjusted Diluted EPS(2)(3)$0.85 - $1.09Depreciation and Amortization(4)$88 million - $92 millionInterest(5)$14 million - $16 millionTax Rate(6)~28%Capital Expenditures$73 million - $78 million1Assumes primarily America's Best new stores.2Refer to "Non-GAAP Financial Measures" below for more information.3Assumes approximately 82 million shares.4Includes amortization of acquisition intangibles of approximately $0.7 million, which is excluded in the definition of Adjusted Operating Income.5Before the impact of gains or losses on change in fair value of derivatives and charges related to debt discounts and deferred financing costs.6Excluding the impact of vesting of restricted stock units and stock option exercises.The fiscal 2026 outlook information provided in this release includes Adjusted Operating Income and Adjusted Diluted EPS guidance. The Company is not able to reconcile these forward-looking non-GAAP measures to GAAP without unreasonable efforts because it is not possible to predict with a reasonable degree of certainty the actual impact of certain items and unanticipated events, including taxes and non-recurring items, which would be included in GAAP results.The fiscal 2026 outlook is forward-looking, subject to significant business, economic, regulatory and competitive uncertainties and contingencies, many of which are beyond the control of the Company and its management, and based upon assumptions with respect to future decisions, which are subject to change. These uncertainties include, but are not limited to, dynamic market conditions, unexpected disruptions including additional regulatory actions impacting international trade such as tariffs, and other macroeconomic risks and uncertainties. Actual results may vary and those variations may be material. As such, the Company's results may not fall within the ranges contained in its fiscal 2026 outlook. The Company uses these forward-looking measures internally to assess and benchmark its results and strategic plans. See "Forward-Looking Statements" below.Conference Call DetailsThe Company will host a conference call to discuss the fourth quarter 2025 financial results and fiscal-year 2026 guidance today, March 4, 2026, at 8:30 a.m. Eastern Time. To pre-register for the conference call and obtain a dial-in number and passcode please refer to the "Investors" section of the Company's website at www.ir.nationalvision.com. A live audio webcast of the conference call will be available on the "Investors" section of the Company's website at www.ir.nationalvision.com, where presentation materials will be posted prior to the conference call. A replay of the audio webcast will also be archived on the "Investors" section of the Company's website.About National Vision Holdings, Inc.National Vision Holdings, Inc. (NASDAQ:EYE) is one of the largest optical retail companies in the United States with over 1,200 stores in 38 states and Puerto Rico. With a mission of helping people by making quality eye care and eyewear more affordable and accessible, the company operates four retail brands: America's Best, Eyeglass World, and Vista Opticals inside select Fred Meyer stores and on select military bases, and an e-commerce website DiscountContacts.com, offering a variety of products and services for customers' eye care needs. For more information, please visit www.nationalvision.com.Forward-Looking StatementsThis press release contains forward-looking statements within the meaning of Section 27A of the Securities Act of 1933, as amended (the "Securities Act") and Section 21E of the Securities Exchange Act of 1934. These statements include, but are not limited to, statements contained under "Fiscal 2026 Outlook" as well as other statements related to our current beliefs and expectations regarding the performance of our industry, the Company's strategic direction, market position, prospects including remote medicine and optometrist recruiting and retention initiatives, and future results. You can identify these forward-looking statements by the use of words such as "outlook," "guidance," "believes," "expects," "potential," "continues," "may," "will," "should," "could," "seeks," "projects," "predicts," "intends," "plans," "estimates," "anticipates" or variations of these words or other comparable words. Caution should be taken not to place undue reliance on any forward-looking statement as such statements speak only as of the date when made. We undertake no obligation to publicly update or review any forward-looking statement, whether as a result of new information, future developments or otherwise, except as required by law. Forward-looking statements are not guarantees and are subject to various risks and uncertainties, which may cause actual results to differ materially from those implied in forward-looking statements. Such factors include, but are not limited to, market volatility, an overall decline in the health of the economy, global macroeconomic conditions and other factors may affect consumer spending or behavior, which could materially harm our sales, profitability and financial condition; we may not be successful in implementing our strategic initiatives, or in anticipating the impact of important strategic initiatives, and our plans for implementing such initiatives may be altered or delayed due to various factors, which may have an adverse impact on our business and financial results; the optical retail industry is highly competitive, and if we do not compete successfully, our business may be materially adversely impacted; our success depends substantially on the value of our owned brands, and failure to maintain, protect, and enhance their value could have a negative impact on our business, financial condition, and results of operations; our success depends upon our marketing, advertising and promotional efforts and if we are unable to implement them successfully or efficiently, or if our competitors are more effective than we are, we may experience a material adverse effect on our business, financial condition and results of operations; if we fail to open and operate new stores (including as a result of store conversions) in a timely and cost-effective manner or fail to successfully enter new markets, our financial performance could be materially adversely affected; our growth is dependent on our ability to increase sales in existing stores and to successfully reinvest in existing stores; if we are unable to successfully implement our pricing strategies, it could have a material adverse impact on our business; failure to recruit and retain vision care professionals for in-store roles or to provide remote care offerings could adversely affect our business, financial condition and results of operations; we are a value-based provider and our business model relies on the low cost of inputs, and factors such as wage rate increases, inflation, cost increases, increases in the price of raw materials and energy prices could have a material adverse effect on our business, financial condition and results of operations; we require significant capital to fund our expanding business including updating our Enterprise Resource Planning ("ERP") and Customer Relationship Management ("CRM"), and other technological, systems and capabilities; our growth strategies could strain our existing resources and cause the performance of our existing stores to suffer; we are subject to risks associated with leasing substantial amounts of space, including future increases in occupancy costs; our e-commerce and omni-channel business faces distinct risks, and our failure to successfully manage those risks could have a negative impact on our profitability; if we fail to retain our existing senior management team, attract qualified new personnel or successfully implement our succession plans, such failure could have a material adverse effect on our business, financial condition and results of operations; our operating results and inventory levels fluctuate on a seasonal basis; catastrophic events, including changing climate and weather patterns leading to severe weather and natural disasters may cause significant business interruptions and expenditures; certain technological advances, greater availability of, or increased consumer preferences for, vision correction alternatives to prescription eyeglasses or contact lenses, or future drug development for the correction of vision-related problems may reduce the demand for our products and materially adversely impact our business and profitability; our profitability and cash flows may be materially adversely affected if we are not successful in managing our inventory balances and inventory shrinkage; we depend on our distribution centers and optical laboratories and the loss of, or disruption in the operations of, one or more of these facilities may adversely affect our ability to process and fulfill customer orders and deliver our products in a timely manner, or at all, and may result in quality issues, which would materially adversely affect our reputation, our business and our profitability; if the performance of our Host brands declines or we are unable to maintain or extend our operating relationships with our Host partners, our business, profitability and cash flows may be adversely affected and we may be required to incur impairment charges; sustainability issues, including those related to climate change, could have a material adverse effect on our business, financial condition and results of operations; our future operational success depends on our ability to develop, maintain and extend relationships with managed vision care companies, vision insurance providers and other third-party payors; we rely on third-party coverage and reimbursement, including government programs, for an increasing portion of our revenues, the future reduction of which could materially adversely affect our results of operations; we face risks associated with vendors from whom our products and certain services are sourced and are dependent on a limited number of suppliers; our ability to source merchandise and services outside of the U.S. could be adversely impacted by changes in U.S. or international laws, including the imposition of tariffs by the U.S. and the resulting consequences; we rely heavily on our information technology systems, as well as those of our vendors, for our business to effectively operate and to safeguard confidential information and any significant failure, inadequacy, interruption or security breach could materially adversely affect our business, financial condition and operations; we are subject to extensive state, local and federal vision care and healthcare laws and regulations and failure to adhere to such laws and regulations would materially adversely affect our business; we are subject to managed vision care laws and regulations and the failure to comply with such laws and regulations could have a materially negative impact on our business, financial condition or results of operations; we are subject to rapidly changing and increasingly stringent laws, regulations, contractual obligations, and industry standards relating to privacy, data security and data protection, which could subject us to liabilities that materially adversely affect our business, operations and financial performance; we could be materially adversely affected by product liability, product recall or personal injury issues; failure to comply with laws, regulations and enforcement activities or changes in statutory, regulatory, accounting and other legal requirements could materially negatively impact our business, financial condition or results of operations; adverse judgments or settlements resulting from legal proceedings relating to our business operations could materially adversely affect our business, financial condition and results of operations; we may not be able to adequately protect our intellectual property, which could harm the value of our brand and materially adversely affect our business; we have a significant amount of indebtedness which could adversely affect our business and financial position, including by limiting our business flexibility and preventing us from meeting our debt obligations; a change in interest rates may adversely affect our business; our credit agreement contains restrictions that limit our flexibility in operating our business; and risks related to owning our common stock, including our ability to comply with requirements to design and implement and maintain effective internal controls. Additional information about these and other factors that could cause National Vision's results to differ materially from those described in the forward-looking statements can be found in filings by National Vision with the Securities and Exchange Commission ("SEC"), including our latest Annual Report on Form 10-K and subsequent Quarterly Reports on Form 10-Q, which are accessible on the SEC's website at www.sec.gov. These factors should not be construed as exhaustive and should be read in conjunction with the other cautionary statements that are included in this release and in our filings with the SEC.Non-GAAP Financial MeasuresTo supplement the Company's financial information presented in accordance with GAAP and aid understanding of the Company's business performance, the Company uses certain non-GAAP financial measures, namely "EBITDA," "Adjusted Operating Income," "Adjusted Operating Margin," "Adjusted EBITDA," "Adjusted EBITDA Margin," "Adjusted Diluted EPS," "Adjusted Comparable Stores Sales Growth," "Adjusted SG&A," and "Adjusted SG&A Percent of Net Revenue." We believe EBITDA, Adjusted Operating Income, Adjusted Operating Margin, Adjusted EBITDA, Adjusted EBITDA Margin, Adjusted Diluted EPS, Adjusted SG&A, and Adjusted SG&A Percent of Net Revenue assist investors and analysts in comparing our operating performance across reporting periods on a consistent basis by excluding items that we do not believe are indicative of our core operating performance. Management believes these non-GAAP financial measures are useful to investors in highlighting trends in our operating performance, while other measures can differ significantly depending on long-term strategic decisions regarding capital structure, the tax jurisdictions in which we operate and capital investments. Management uses these non-GAAP financial measures to supplement GAAP measures of performance in the evaluation of the effectiveness of our business strategies, to make budgeting decisions, to establish discretionary annual incentive compensation and to compare our performance against that of other peer companies using similar measures. Management supplements GAAP results with non-GAAP financial measures to provide a more complete understanding of the factors and trends affecting the business than GAAP results alone.To supplement the Company's comparable store sales growth presented in accordance with GAAP, the Company provides "Adjusted Comparable Store Sales Growth," which is a non-GAAP financial measure we believe is useful because it provides timely and accurate information relating to the two core metrics of retail sales: number of transactions and value of transactions. Management uses Adjusted Comparable Store Sales Growth as the basis for key operating decisions, such as allocation of advertising to particular markets and implementation of special marketing programs. Accordingly, we believe that Adjusted Comparable Store Sales Growth provides timely and accurate information relating to the operational health and overall performance of each brand. We also believe that, for the same reasons, investors find our calculation of Adjusted Comparable Store Sales Growth to be meaningful.EBITDA: We define EBITDA from continuing operations as net income (loss), minus income (loss) from discontinued operations, net of tax, plus interest expense (income), net, income tax provision (benefit), and depreciation and amortization.Adjusted Operating Income: We define Adjusted Operating Income from continuing operations as net income (loss), minus income (loss) from discontinued operations, net of tax, plus interest expense (income), net and income tax provision (benefit), further adjusted to exclude stock-based compensation expense, (gain) loss on extinguishment of debt, asset impairment, litigation settlement, secondary offering expenses, management realignment expenses, long-term incentive plan expenses, amortization of acquisition intangibles, Enterprise Resource Planning ("ERP") and Customer Relationship Management ("CRM") implementation expenses, shareholder activism costs, severance and associate-related costs associated with organization restructuring and certain other expenses.Adjusted Operating Margin: We define Adjusted Operating Margin from continuing operations as Adjusted Operating Income from continuing operations as a percentage of total net revenue.Adjusted EBITDA: We define Adjusted EBITDA from continuing operations as net income (loss), minus income (loss) from discontinued operations, net of tax, plus interest expense (income), net, income tax provision (benefit) and depreciation and amortization, further adjusted to exclude stock-based compensation expense, (gain) loss on extinguishment of debt, asset impairment, litigation settlement, secondary offering expenses, management realignment expenses, long-term incentive plan expenses, ERP and CRM implementation expenses, shareholder activism costs, severance and associate-related costs associated with organization restructuring and certain other expenses.Adjusted EBITDA Margin: We define Adjusted EBITDA Margin from continuing operations as Adjusted EBITDA from continuing operations as a percentage of total net revenue.Adjusted Diluted EPS: We define Adjusted Diluted EPS from continuing operations as diluted earnings (loss) per share, minus diluted earnings (loss) per share from discontinued operations, adjusted for the per share impact of stock-based compensation expense, (gain) loss on extinguishment of debt, asset impairment, litigation settlement, secondary offering expenses, management realignment expenses, long-term incentive plan expenses, amortization of acquisition intangibles, amortization of debt discounts and deferred financing costs of our term loan borrowings, amortization of the conversion feature and deferred financing costs related to our 2.50% convertible senior notes due on May 15, 2025 ("2025 Notes") when not required under U.S. GAAP to be added back for diluted earnings (loss) per share, derivative fair value adjustments, ERP and CRM implementation expenses, shareholder activism costs, severance and associate-related costs associated with organization restructuring, certain other expenses, and related tax effects.Adjusted SG&A: We define Adjusted SG&A from continuing operations as SG&A from continuing operations adjusted to exclude stock-based compensation expense, litigation settlement, secondary offering expenses, management realignment expenses, long-term incentive plan expense, ERP and CRM implementation expenses, shareholder activism costs, severance and associate-related costs associated with organization restructuring and certain other expenses.Adjusted SG&A Percent of Net Revenue: We define Adjusted SG&A Percent of Net Revenue from continuing operations as Adjusted SG&A from continuing operations as a percentage of total net revenue.Adjusted Comparable Store Sales Growth: We measure Adjusted Comparable Store Sales Growth as the increase or decrease in sales recorded by the comparable store base in any reporting period, compared to sales recorded by the comparable store base in the prior reporting period, which we calculate as follows: (i) sales are recorded at the point of sale (ii) sales are adjusted for managed care insurance collection estimates (iii) stores are added to the calculation during the 13th full fiscal month following the store's opening; (iv) closed stores are removed from the calculation for time periods that are not comparable; (v) sales from partial months of operation are excluded when stores do not open or close on the first day of the month; and (vi) when applicable, we adjust for the effect of the 53rd week. Quarterly, year-to-date and annual adjusted comparable store sales are aggregated using only sales from all whole months of operation included in both the current reporting period and the prior reporting period. When a partial month is excluded from the calculation, the corresponding month in the subsequent period is also excluded from the calculation. There may be variations in the way in which some of our competitors and other retailers calculate comparable store sales. As a result, our adjusted comparable store sales may not be comparable to similar data made available by other retailers.EBITDA, Adjusted Operating Income, Adjusted Operating Margin, Adjusted EBITDA, Adjusted EBITDA Margin, Adjusted Diluted EPS, Adjusted SG&A, Adjusted SG&A Percent of Net Revenue and Adjusted Comparable Store Sales Growth are not recognized terms under U.S. GAAP and should not be considered as an alternative to net income or the ratio of net income to net revenue as a measure of financial performance, SG&A, the ratio of SG&A to net revenue as a measure of financial performance, cash flows provided by operating activities as a measure of liquidity, comparable store sales growth as a measure of operating performance, or any other performance measure derived in accordance with U.S. GAAP. Additionally, these measures are not intended to be a measure of free cash flow available for management's discretionary use as they do not consider certain cash requirements such as interest payments, tax payments and debt service requirements. The presentations of these measures have limitations as analytical tools and should not be considered in isolation, or as a substitute for analysis of our results as reported under U.S. GAAP. Because not all companies use identical calculations, the presentations of these measures may not be comparable to other similarly titled measures of other companies and can differ significantly from company to company.Please see "Reconciliation of Non-GAAP to GAAP Financial Measures" below for reconciliations of non-GAAP financial measures used in this release to their most directly comparable GAAP financial measures.National Vision Holdings, Inc. and SubsidiariesConsolidated Balance SheetsIn Thousands, Except Share Data As ofJanuary 3, 2026 As ofDecember 28, 2024ASSETS Current assets: Cash and cash equivalents$38,708 $73,948 Accounts receivable, net 57,322 49,938 Inventories 89,318 93,918 Prepaid expenses and other current assets 40,374 32,024 Total current assets 225,722 249,828 Noncurrent assets: Property and equipment, net 344,619 362,175 Goodwill 700,642 698,305 Trademarks and trade names 240,547 240,547 Other intangible assets, net 7,554 8,269 Right of use assets 394,896 408,589 Other assets 69,698 40,058 Total noncurrent assets 1,757,956 1,757,943 Total assets$1,983,678 $2,007,771 LIABILITIES AND STOCKHOLDERS' EQUITY Current liabilities: Accounts payable$78,999 $53,643 Other payables and accrued expenses 109,674 109,036 Unearned revenue 52,279 42,002 Deferred revenue 64,560 62,507 Current maturities of long-term debt and finance lease obligations 16,583 101,392 Current operating lease obligations 90,313 99,694 Total current liabilities 412,408 468,274 Noncurrent liabilities: Long-term debt and finance lease obligations, less current portion and debt discount 229,327 248,610 Noncurrent operating lease obligations 358,377 366,335 Deferred revenue 22,517 22,082 Other liabilities 8,944 8,228 Deferred income taxes, net 82,572 77,909 Total noncurrent liabilities 701,737 723,164 Commitments and contingencies Stockholders' equity: Common stock, $0.01 par value; 200,000,000 shares authorized; 86,278,538 and 85,444,263 shares issued as of January 3, 2026 and December 28, 2024, respectively; 79,416,050 and 78,775,117 shares outstanding as of January 3, 2026 and December 28, 2024, respectively 862 854 Additional paid-in capital 834,000 807,048 Accumulated other comprehensive loss (121) — Retained earnings 255,717 226,117 Treasury stock, at cost; 6,862,488 and 6,669,146 shares as of January 3, 2026 and December 28, 2024, respectively (220,925) (217,686)Total stockholders' equity 869,533 816,333 Total liabilities and stockholders' equity$1,983,678 $2,007,771 Note: Fiscal year 2025 includes 53 weeks. Fiscal year 2024 includes 52 weeks.National Vision Holdings, Inc. and SubsidiariesConsolidated Statements of Operations and Comprehensive (Loss) IncomeIn Thousands, Except Per Share Amounts Three Months Ended Fiscal Year January 3, 2026(Unaudited) December 28, 2024(Unaudited) 2025 2024 Revenue: Net product sales$403,755 $349,933 $1,604,592 $1,463,139 Net sales of services and plans 99,656 87,345 382,896 360,181 Total net revenue 503,411 437,278 1,987,488 1,823,320 Costs applicable to revenue (exclusive of depreciation and amortization): Products 114,998 102,385 461,213 Full story available on Benzinga.com

#STOCKS