thisdaylivehace 36d
La campaña de perforación Okoro de AMNI refuerza la confianza en el sector energético indígena de Nigeria
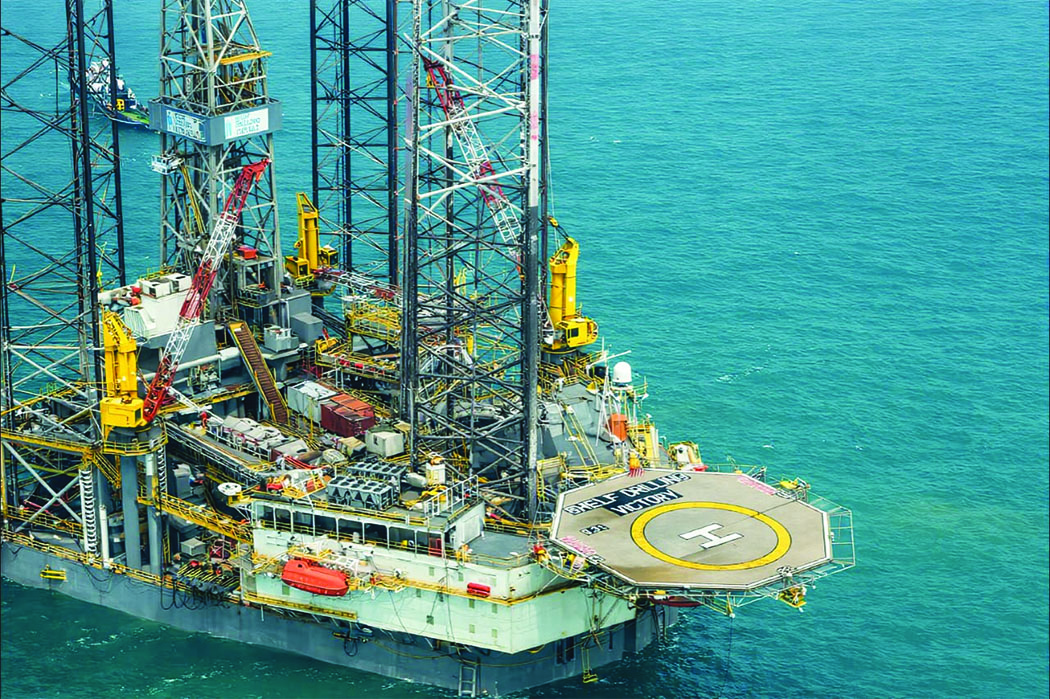
Bayo Adeoye La llegada de una plataforma de perforación al campo Okoro marca más que el inicio de otra campaña costa afuera para AMNI International Petroleum Development Company. Representa un
#ECONOMY