in_tradingview24d ago
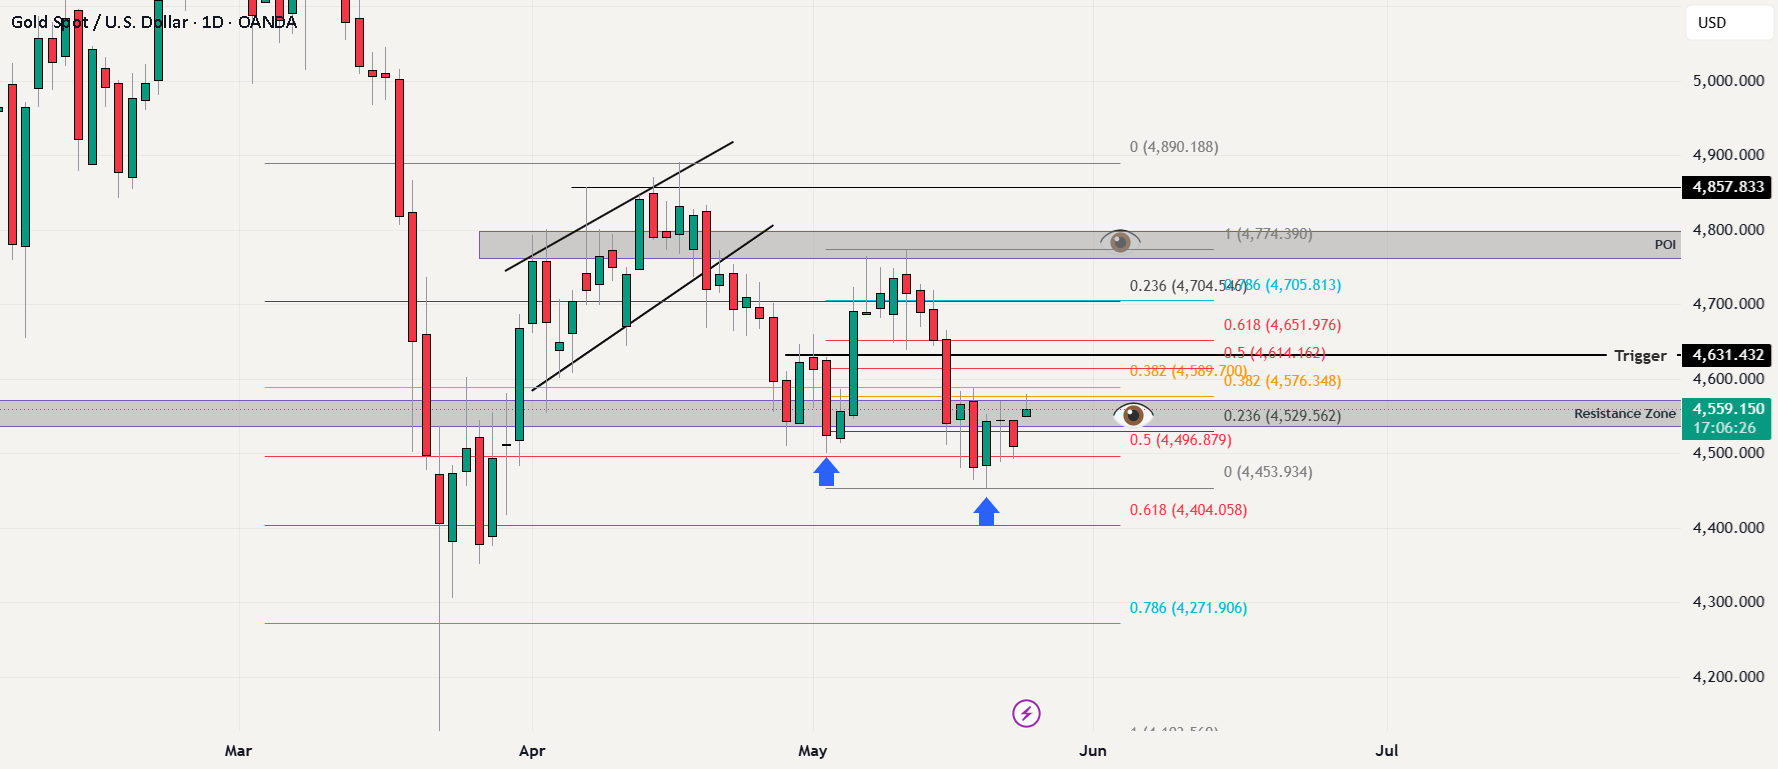
Price closed last week below the $4,530-60 major support zone on a daily closing basis. That area has now flipped to resistance. Today's bounce is trading right into the that resistance zone. The Fibonacci Map (4,774 high to 4,453 low): 0 -- $4,774 (high) 0.236 -- $4,704 0.382 -- $4,589 / $4,576 0.5 -- $4,614 -- FIRST RESISTANCE. Bulls need a daily close above this to show any real strength. 0.618 -- $4,651 0.786 -- $4,705 1 -- $4,453 (cycle low / week low) Today's +1.13% bounce is running directly into the $4,530-60 resistance zone. This is the first test of former support as resistance. How price reacts on the daily close today tells you everything. Two scenarios: Daily close above $4,560 but below $4,614: Mild positive. Inside resistance zone. Not enough. Need follow through tomorrow toward $4,614. Daily close above $4,614 (0.5 Fib): First real sign of bull strength. Bias shifts cautiously. Next targets $4,651 then $4,705. Daily close back below $4,530: Resistance held. Bounce failed. $4,453 week low retested. If that breaks, $4,404 opens. Volume remains flat. Pattern remains choppy.