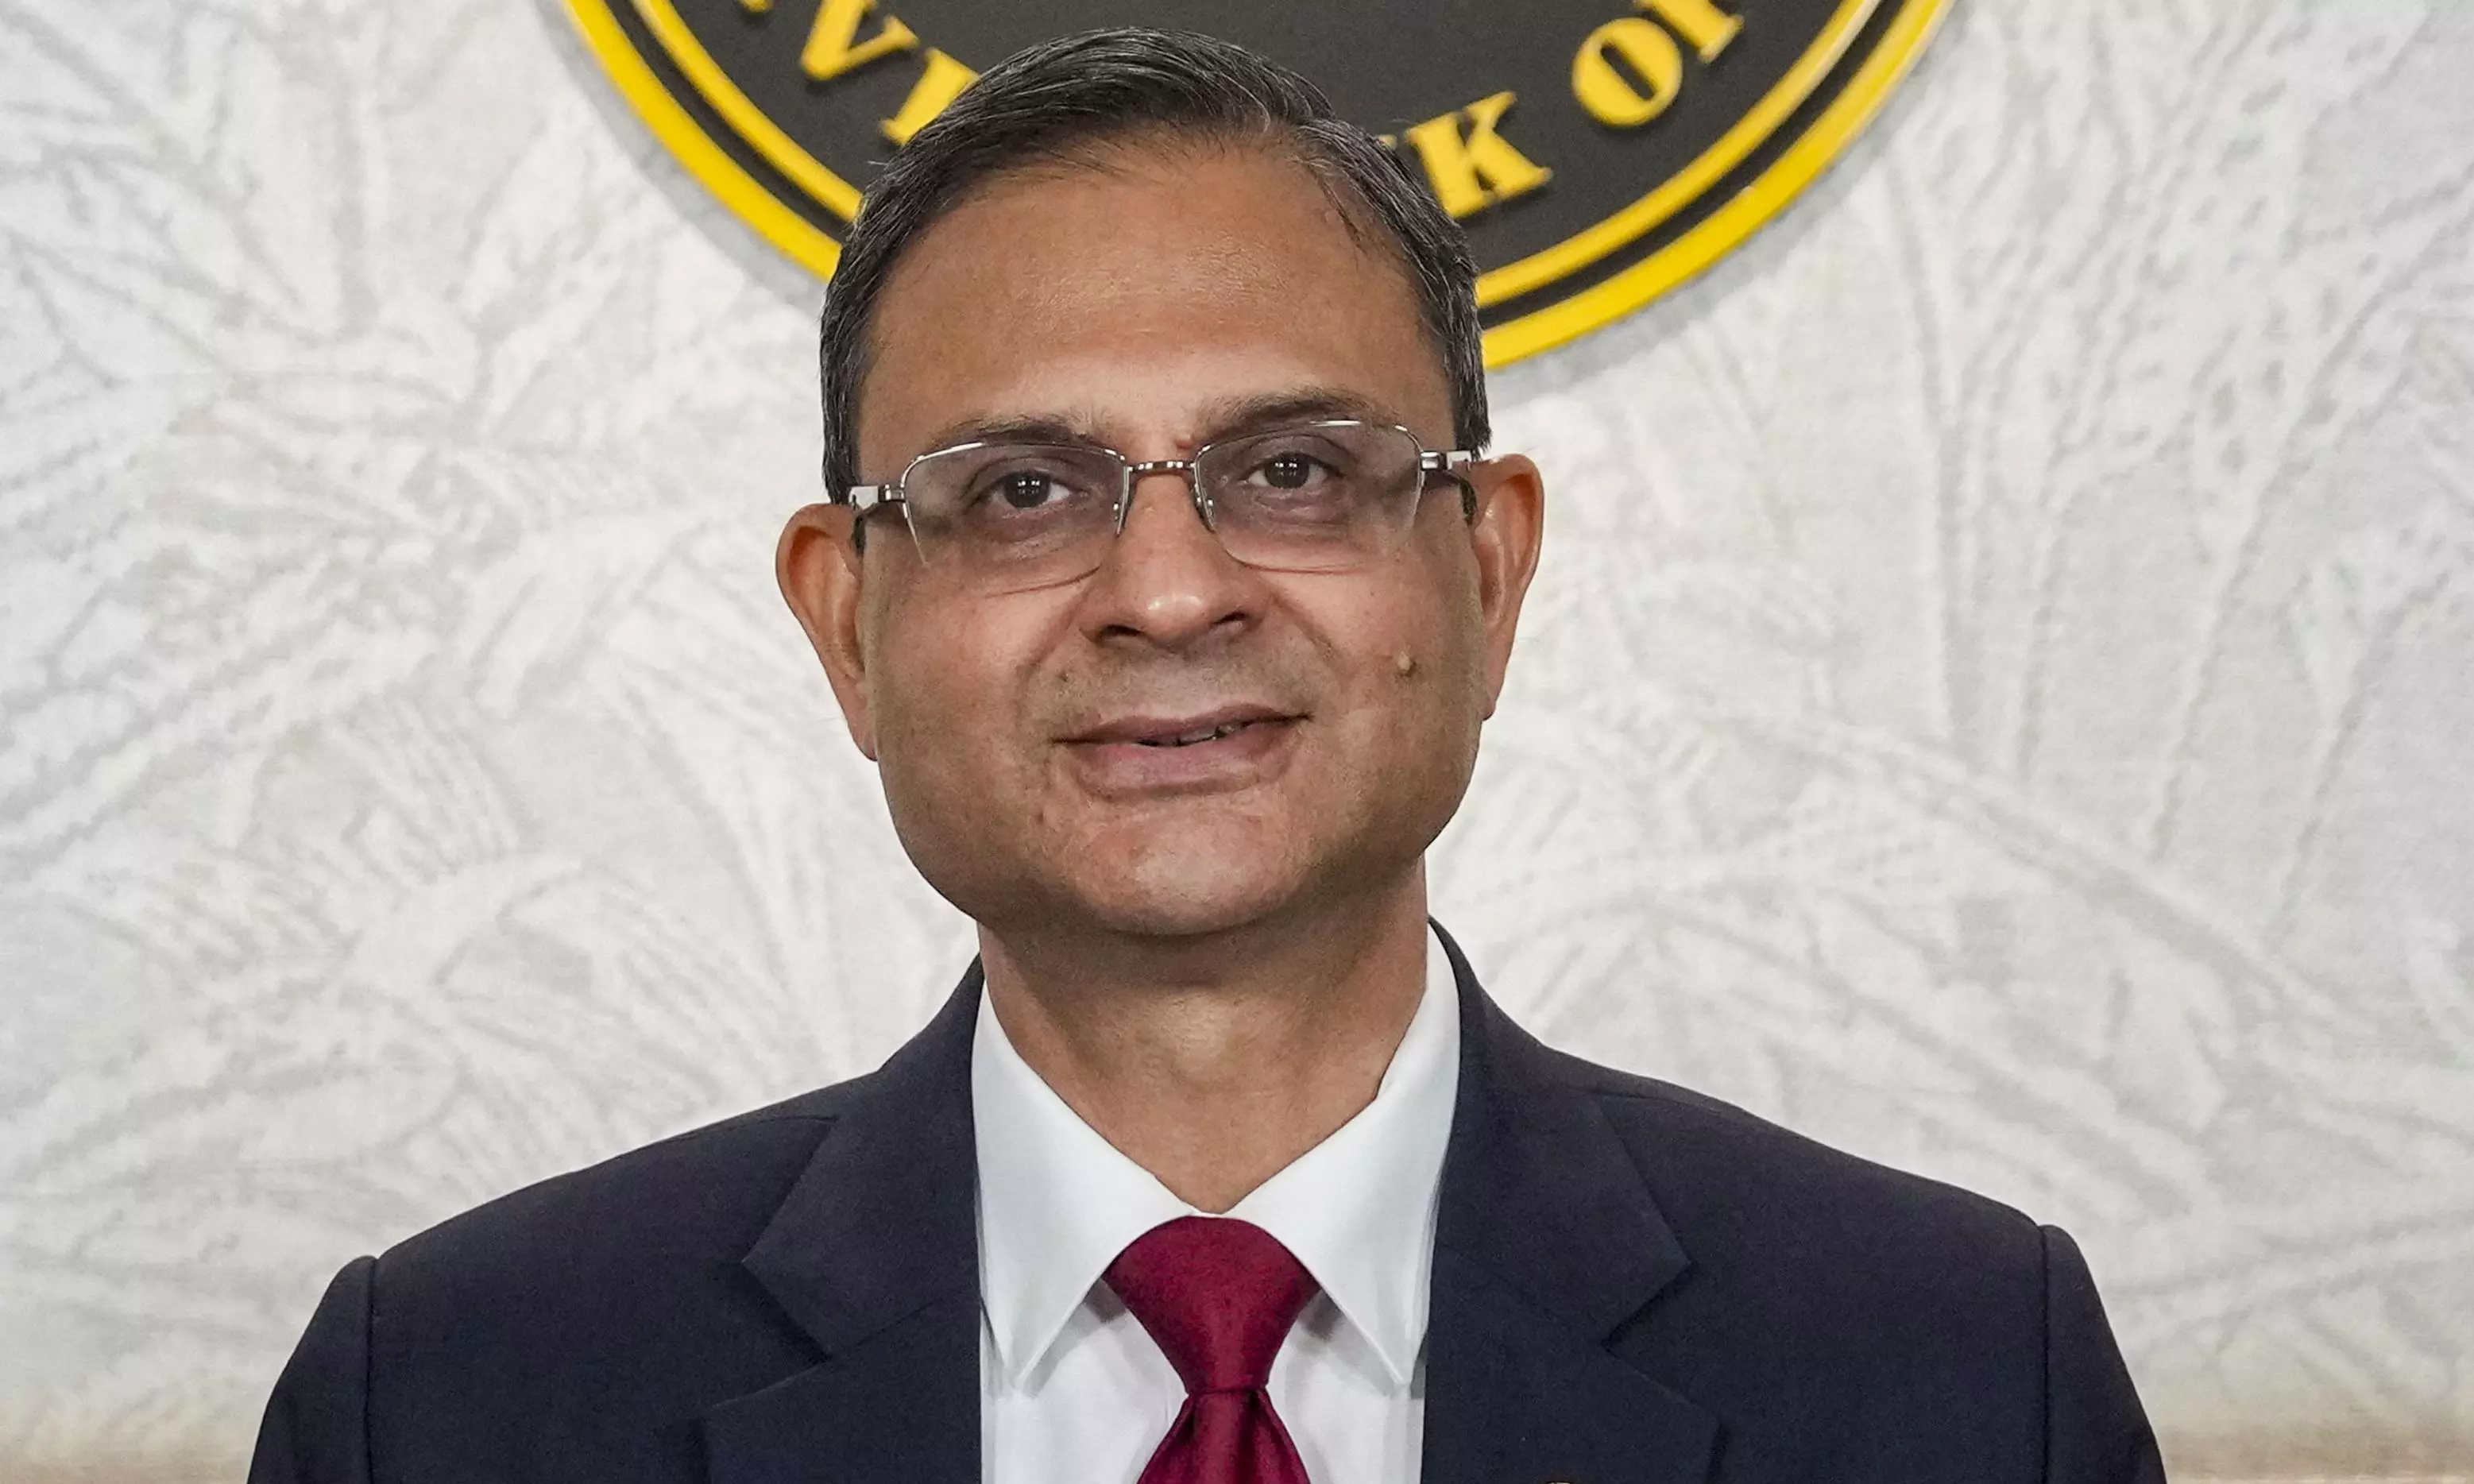
Dashboard

Financial News

GIFTNIFTY Short Range /Intra-Swing Level Analysis 24th MAR 2026
in_tradingview26d ago

GIFTNIFTY Short Range /Intra-Swing Level Analysis 24th MAR 2026

GIFTNIFTY Short Range /Intra-Swing Level Analysis for 24th MAR 2026 ━━━━━🟥🟧🟨🟩🟦🟪⬛━━━━━ 💥Level Interpretation / description: ✍🏻L#1: If the candle crossed & stays above the “Buy Gen”, it is treated / considered as Bullish bias. L#2: Possibility / Probability of REVERSAL near 🔕RLB#1 & 🔔UBTgt L#3: If the candle stays above “Sell Gen” but below “Buy Gen”, it is treated / considered as Sidewise. Aggressive Traders can take Long position near “Sell Gen” either retesting or crossed from Below & vice-versa i.e. can take Short position near “Buy Gen” either retesting or crossed downward from Above. L#4: If the candle crossed & stays below the “Sell Gen”, it is treated / considered a Bearish bias. L#5: Possibility / Probability of REVERSAL near 🔕RLS#1 & 🔔USTgt HZB (Buy side) & HZS (Sell side) => Hurdle Zone, ✍🏻 *** Specialty of “HZB#1, HZB#2 HZS#1 & HZS#2” is Sidewise (behaviour in Nature) Rest Plotted and Mentioned on Chart Color code Used: Green =. Positive bias. Red =. Negative bias. RED in Between Green means Trend Finder / Momentum Change / CYCLE Change and Vice Versa. Notice One thing: HOW LEVELS are Working. Use any Momentum Indicator / Oscillator or as you "USED to" to Take entry. ━━━━━🟥🟧🟨🟩🟦🟪⬛━━━━━ ⚠️ DISCLAIMER: The information, views, and ideas shared here are purely for educational and informational purposes only. They are not intended as investment advice or a recommendation to buy, sell, or hold any financial instruments. I am not a SEBI-registered financial adviser. Trading and investing in the stock market involves risk, and you should do your own research and analysis. You are solely responsible for any decisions made based on this research. "🔔As HARD EARNED MONEY IS YOUR's, So DECISION SHOULD HAVE TO BE YOUR's". ━━━━━🟥🟧🟨🟩🟦🟪⬛━━━━━ ❇️ Follow notification about periodical View 💥 Do Comment for Stock WEEKLY Level Analysis.🚀 📊 Do you agree with this view? ✈️ HIT THE PLANE ICON if this technical observation resonates with you. It will Motivate me. ━━━━━🟥🟧🟨🟩🟦🟪⬛━━━━━ 💡 If You LOOKING any CHART & want for Level and ANALYZE? Share your desired stock names in the comments below! I will try to analyze the chart Levels, patterns and share my technical view (so far my Knowledge). If Viewers think It can identify meaningful setups. Looking forward to hearing from all of you — let's keep this discussion going and help each other make better trading decisions. ___________🔕^^^⚫⚪^^^⚪⚫^^^🔔___________

#STOCKS
Several telcos among online services hit by internet disruptions
asiaone26d ago

Several telcos among online services hit by internet disruptions

Users reported service disruptions on Monday (March 23) afternoon, affecting both broadband and mobile services and applications, with Singtel facing the biggest surge. In posts shared on Reddit, users said that both broadband and 5G services appeared to be down simultaneously at around 3.40pm."Every website and messenger apps stopped working, but data still got through," one user wrote. Another said:...

#TECH
US needs more energy development to power AI, Google president says
miningweekly26d ago

US needs more energy development to power AI, Google president says

The US may not be scaling energy supplies fast enough to to meet the demands of the artificial intelligence expansion, Ruth Porat, president and chief investment officer of Google parent Alphabet said on Monday, referring to the vast amount of capacity needed to power the growth in AI data centers. "We are concerned that we are not full throttle on energy,” she said at the CERAWeek conference in Houston, adding that the country will need to embrace every source of energy to meet the moment.

#COMMODITIES
Japan's core inflation slows below BOJ target, complicates rate path
thestar_my26d ago

Japan's core inflation slows below BOJ target, complicates rate path

TOKYO: Japan's core consumer inflation hit 1.6% in February to slide below the central bank's 2% target for the first time in nearly four years, data showed on Tuesday, complicating its efforts to justify further interest rate hikes. Read full story

#ECONOMY
Bitcoin and Ethereum officially commodities: How the 91% S&P correlation signals a new era
e2726d ago

Bitcoin and Ethereum officially commodities: How the 91% S&P correlation signals a new era

The cryptocurrency market advanced 3.22 per cent to reach a total capitalisation of US$2.42T over the past 24 hours, a move that signals a profound shift in market structure rather than mere speculative enthusiasm. This rally stems from a watershed moment in regulatory history. The Securities and Exchange Commission and the Commodity Futures Trading Commission [...] The post Bitcoin and Ethereum officially commodities: How the 91% S&P correlation signals a new era appeared first on e27 .

#CRYPTO#COMMODITIES
Big players act during market panic.
in_tradingview26d ago

Big players act during market panic.

If you look at what's happening, the story is no longer about the news. It's not CPI, not FOMC, nor the conflict. The market has moved beyond reacting to data — we are currently in a clear liquidity-driven move phase. From the peak, gold has dropped over 1300 points — and the important thing is: this is not a random drop, but a deliberate process. Big money doesn't need news to push prices. They need liquidity. What is happening is the process of: Distributing at the peak Pulling prices down to break the structure Continuously creating panic to force retail to exit The real question is not "will gold go down or up," but: 👉 Where do the big players need the price to go to gather enough liquidity? Currently, the 4000 level is where most of the market starts to expect a bottom. This is the problem. When too many people see a level as a "potential bottom," it often becomes: Either a place for a strong reaction (short-term bounce) Or a place to be broken to sweep the final liquidity In the logic of money flow, a real bottom doesn't form when the market still has expectations. A bottom only appears when: Psychology is completely broken Selling is everywhere No one believes the price can rise 👉 And currently, the market still has too many people "waiting for the bottom." Therefore, the scenario to consider is not just 4000 holding, but: Sweep below 4000 Create a false breakdown And only then will big money start to accumulate Returning to the current plan on H4. The price has reacted correctly at the FVG + Fibo + demand + trendline area, but there are no signs showing real buying power control. The rebound only stopped at a technical level and quickly weakened. The structure is still very clear: Lower high – lower low No bullish BOS Every rebound is sold off Areas to watch today: 4400–4500: retest supply + trendline area → if the price returns, this is still a good sell area 4100: nearest support area, short-term liquidity 4000: extremely strong psychological area — where the market can create a big trap The main scenario remains unchanged: If the price continues to be rejected above → the market will extend the decline to 4100 and possibly deeper below 4000 to complete the liquidity sweep process. In summary, this is no longer a "news reaction" market, but a market of money flow and liquidity. 👉 Don't ask what the news says 👉 Look at where the price is going to gather liquidity And currently, everything still points to one thing: This is not the bottom — this is the process of creating one. 📊 LucasGrayTrading provides an updated multi-timeframe structure perspective, important liquidity areas, and market scenarios ahead of the next big 1000–2000 pip breakouts.

#COMMODITIES