
zdnet118d ago
This pocket-sized Android phone brought me back to a decade ago - but it's built to last
The Ulefone Armor Mini 20 Pro is a refreshing throwback to small screens and candy bar-shaped handsets.
#TECH
The Ulefone Armor Mini 20 Pro is a refreshing throwback to small screens and candy bar-shaped handsets.

BENTON TOWNSHIP — Benton Township officials are moving forward with a plan to install security cameras in spaces like township buildings and parks.

Small nuclear reactors are pitched as cheaper, safer, faster and easier to finance than their conventional counterparts. Hype around them is building fast, but some experts warn it ignores fundamental problems

The search for a replacement for Federal Reserve Chair Jerome Powell has taken yet another turn, with a dark horse contender gaining momentum: BlackRock’s Rick Rieder.

Social-first publisher deal brings cost of Future acqusitions to £1.6bn over ten years.The post Future plc buys beauty and fashion brand Sheerluxe for £40m appeared first on Press Gazette.

The American Petroleum Institute (API) has released its weekly report on the inventory levels of US crude oil, gasoline, and distillates stocks, a key indicator of US petroleum demand. The latest data shows a rise in crude inventories, but the increase is less than what was anticipated, suggesting a stronger demand for crude oil. The ...

BEIJING--(BUSINESS WIRE)--Jan 22, 2026--

We calculated that in 2013, Canada was worth $17 trillion more than the U.S.

DUBAI, United Arab Emirates, Jan. 22, 2026 (GLOBE NEWSWIRE) -- Mutuum Finance (MUTM), a new crypto project developing a decentralized lending protocol on Ethereum, has announced the completion of its security audit conducted by Halborn Security. The audit is one of several components tied to the protocol’s roadmap as the project prepares for its upcoming V1 launch window.
22 January 2026 | SAINT HELIER, Jersey | CoinShares International Limited ("CoinShares" or the "Company") (Nasdaq Stockholm: CS; US OTCQX: CNSRF), with an announced merger with Vine Hill Capital Investment Corp (Nasdaq: VCIC), a leading global asset manager specialising in digital assets, today announces that the Royal Court of Jersey has scheduled a directions hearing for 17 February 2026 in connection with its proposed business combination (the “Transaction”) with Vine Hill Capital Investment Corp. ("Vine Hill").
Fourth quarter 2025 net income available to common stockholders of $96.3 million, up 44% year-over-yearReaching record-levels, Book Value and Tangible Book Value(4) per share both increased 13% year-over-yearCapital ratios continue to be strong, achieving 12.1% CET1 and 16.1% Total CapitalDALLAS, Jan. 22, 2026 (GLOBE NEWSWIRE) -- "Consecutive strong quarters to close 2025 validate our multi-year transformation strategy and demonstrate the resilience of our business model in a complex market environment," said Rob C. Holmes, Chairman, President & CEO. "Surpassing our long-term Return on Average Assets goal of 1.1% in the final two quarters underscores the effectiveness of our deliberate, disciplined approach. We are now positioned to capitalize on our increasingly differentiated platform, executing seamlessly for clients, delivering comprehensive solutions across market events and driving meaningful, sustainable value for our investors." 4th Quarter 3rd Quarter 4th Quarter Full Year Full Year(dollars in thousands except per share data) 2025 2025 2024 2025 2024 Summary Income Statement Net interest income$267,437 $271,771 $229,607 $1,028,637 $901,300 Non-interest income 60,046 68,583 54,074 227,142 31,046 Total revenue 327,483 340,354 283,681 1,255,779 932,346 Non-interest expense 184,198 190,575 172,159 768,069 758,285 Pre-provision net revenue(1) 143,285 149,779 111,522 487,710 174,061 Provision for credit losses 11,000 12,000 18,000 55,000 67,000 Net income available to common stockholders 96,347 100,897 66,711 312,994 60,258 Non-interest income, adjusted(2)$60,046 $68,583 $54,074 $229,028 $210,627 Total revenue, adjusted(2) 327,483 340,354 283,681 1,257,665 1,111,927 Non-interest expense, adjusted(2) 186,440 190,575 172,159 768,910 742,533 Pre-provision net revenue, adjusted(1)(2) 141,043 149,779 111,522 488,755 369,394 Net income to common stockholders, adjusted(2) 94,631 100,897 66,711 313,791 208,345 Key Metrics Diluted earnings per common share$2.12 $2.18 $1.43 $6.79 $1.28 Diluted earnings per common shares, adjusted(2)$2.08 $2.18 $1.43 $6.80 $4.43 Return on average assets 1.22% 1.30% 0.88% 1.04% 0.25%Return on average assets, adjusted(2) 1.20% 1.30% 0.88% 1.04% 0.74%Return on average common equity 11.18% 12.04% 8.50% 9.59% 2.04%Return on average common equity, adjusted(2) 10.98% 12.04% 8.50% 9.61% 7.05%Efficiency ratio(3) 56.2% 56.0% 60.7% 61.2% 81.3%Efficiency ratio, adjusted(2)(3) 56.9% 56.0% 60.7% 61.1% 66.8%Net interest margin 3.38% 3.47% 2.93% 3.35% 3.03%Book value per share$75.28 73.05 $66.36 $75.28 $66.36 Tangible book value per share(4)$75.25 73.02 $66.32 $75.25 $66.32 CET1 ratio 12.1% 12.1% 11.4% 12.1% 11.4% Balance Sheet Total assets$31,540,274 $32,536,980 $30,731,883 Loans held for investment 17,976,183 18,134,059 17,234,492 Loans held for investment, mortgage finance 6,064,019 6,057,804 5,215,574 Total deposits 26,448,767 27,505,398 25,238,599 Stockholders' equity 3,631,382 3,637,098 3,367,936 (1) Net interest income plus non-interest income, less non-interest expense.(2) These adjusted measures are non-GAAP measures. Please refer to "GAAP to Non-GAAP Reconciliations" for the computations of these adjusted measures and the reconciliation of these non-GAAP measures to the most directly comparable GAAP measure.(3) Non-interest expense divided by the sum of net interest income and non-interest income.(4) Stockholders' equity excluding preferred stock, less goodwill and intangibles, divided by shares outstanding at period end.FOURTH QUARTER 2025 COMPARED TO THIRD QUARTER 2025For the fourth quarter of 2025, net income available to common stockholders was $96.3 million, or $2.12 per diluted share, compared to $100.9 million, or $2.18 per diluted share, for the third quarter of 2025.Provision for credit losses for the fourth quarter of 2025 was $11.0 million, compared to $12.0 million for the third quarter of 2025. The $11.0 million provision for credit losses recorded in the fourth quarter of 2025 resulted primarily from an increase in criticized loans and $10.7 million in net charge-offs.Net interest income was $267.4 million for the fourth quarter of 2025, compared to $271.8 million for the third quarter of 2025, primarily due to a decrease in earning asset yields, partially offset by a decrease in funding costs. Net interest margin for the fourth quarter of 2025 was 3.38%, a decrease of 9 basis points from the third quarter of 2025. Loans Held for Investment ("LHI"), excluding mortgage finance, yields decreased 25 basis points from the third quarter of 2025 and LHI, mortgage finance, yields decreased 19 basis points from the third quarter of 2025. Total cost of deposits was 2.41% for the fourth quarter of 2025, a 21 basis point decrease from the third quarter of 2025.Non-interest income for the fourth quarter of 2025 decreased $8.5 million compared to the third quarter of 2025 primarily due to decreases in investment banking and advisory fees, trading income and other non-interest income.Non-interest expense for the fourth quarter of 2025 decreased $6.4 million compared to the third quarter of 2025, primarily due to decreases in salaries and benefits and FDIC insurance assessment expense, partially offset by increases in marketing expense, communications and technology expense and other non-interest expense. During the fourth quarter of 2025, the FDIC determined that the special assessment extended collection period was no longer necessary, resulting in the release of related accruals.FOURTH QUARTER 2025 COMPARED TO FOURTH QUARTER 2024Net income available to common stockholders was $96.3 million, or $2.12 per diluted share, for the fourth quarter of 2025, compared to $66.7 million, or $1.43 per diluted share, for the fourth quarter of 2024.The fourth quarter of 2025 included a $11.0 million provision for credit losses, reflecting a linked quarter increase in criticized loans and $10.7 million in net charge-offs, compared to a $18.0 million provision for credit losses for the fourth quarter of 2024.Net interest income increased to $267.4 million for the fourth quarter of 2025, compared to $229.6 million for the fourth quarter of 2024, primarily due to an increase in average earning assets and a decrease in funding costs, partially offset by an increase in average interest bearing liabilities. Net interest margin increased 45 basis points to 3.38% for the fourth quarter of 2025, as compared to the fourth quarter of 2024. LHI, excluding mortgage finance, yields decreased 12 basis points compared to the fourth quarter of 2024 and LHI, mortgage finance yields increased 40 basis points from the fourth quarter of 2024. Total cost of deposits decreased 40 basis points compared to the fourth quarter of 2024.Non-interest income for the fourth quarter of 2025 increased $6.0 million compared to the fourth quarter of 2024 primarily due to increases in service charges on deposit accounts and investment banking and advisory fee income.Non-interest expense for the fourth quarter of 2025 increased $12.0 million compared to the fourth quarter of 2024, primarily due to increases in salaries and benefits, communications and technology expense and other non-interest expense, partially offset by decreases in legal and professional expense and FDIC insurance assessment expense.CREDIT QUALITYNet charge-offs of $10.7 million were recorded during the fourth quarter of 2025, compared to net charge-offs of $13.7 million and $12.1 million during the third quarter of 2025 and the fourth quarter of 2024, respectively. Criticized loans totaled $634.9 million at December 31, 2025, compared to $529.7 million at September 30, 2025 and $714.0 million at December 31, 2024. Non-accrual LHI totaled $116.9 million at December 31, 2025, compared to $96.1 million at September 30, 2025 and $111.2 million at December 31, 2024. The ratio of non-accrual LHI to total LHI for the fourth quarter of 2025 was 0.49%, compared to 0.40% for the third quarter of 2025 and 0.50% for the fourth quarter of 2024. The ratio of total allowance for credit losses to total LHI was 1.38% at December 31, 2025, compared to 1.37% and 1.45% at September 30, 2025 and December 31, 2024, respectively.REGULATORY RATIOS AND CAPITALAll regulatory ratios continue to be in excess of "well capitalized" requirements as of December 31, 2025. CET1, tier 1 capital, total capital and leverage ratios were 12.1%, 13.6%, 16.1% and 11.7%, respectively, at December 31, 2025, compared to 12.1%, 13.6%, 16.1% and 11.9%, respectively, at September 30, 2025 and 11.4%, 12.8%, 15.4% and 11.3%, respectively, at December 31, 2024. At December 31, 2025, our ratio of tangible common equity to total tangible assets was 10.6%, compared to 10.3% at September 30, 2025 and 10.0% at December 31, 2024.Effective December 12, 2025, the Company's board of directors authorized a new share repurchase program under which the Company may repurchase up to $200.0 million in shares of its outstanding common stock through December 31, 2026. Remaining repurchase authorization under the January 22, 2025 share repurchase program was terminated upon authorization of this new program.During the fourth quarter of 2025, the Company repurchased 1,445,212 shares of its common stock for an aggregate purchase price, including excise tax expense, of $126.6 million, at a weighted average price of $86.76 per share. All shares were repurchased under the January 22, 2025 shares repurchase program.About Texas Capital Bancshares, Inc.Texas Capital Bancshares, Inc. (NASDAQ®: TCBI), a member of the Russell 2000® Index and the S&P MidCap 400®, is the parent company of Texas Capital Bank ("TCB"). Texas Capital is the collective brand name for TCB and its separate, non-bank affiliates and wholly-owned subsidiaries. Texas Capital is a full-service financial services firm that delivers customized solutions to businesses, entrepreneurs and individual customers. Founded in 1998, the institution is headquartered in Dallas with offices in Austin, Houston, San Antonio and Fort Worth, and has built a network of clients across the country. With the ability to service clients through their entire lifecycles, Texas Capital has established commercial banking, consumer banking, investment banking and wealth management capabilities. All services are subject to applicable laws, regulations, and service terms. Deposit and lending products and services are offered by TCB. For deposit products, member FDIC. For more information, please visit www.texascapital.com.Forward Looking StatementsThis communication contains "forward-looking statements" within the meaning of and pursuant to the Private Securities Litigation Reform Act of 1995 regarding, among other things, TCBI's financial condition, results of operations, business plans and future performance. These statements are not historical in nature and may often be identified by the use of words such as "believes," "projects," "expects," "may," "estimates," "should," "plans," "targets," "intends" "could," "would," "anticipates," "potential," "confident," "optimistic" or the negative thereof, or other variations thereon, or comparable terminology, or by discussions of strategy, objectives, estimates, trends, guidance, expectations and future plans. Because forward-looking statements relate to future results and occurrences, they are subject to inherent and various uncertainties, risks, and changes in circumstances that are difficult to predict, may change over time, are based on management's expectations and assumptions at the time the statements are made and are not guarantees of future results. Numerous risks and other factors, many of which are beyond management's control, could cause actual results to differ materially from future results expressed or implied by such forward-looking statements. While there can be no assurance that any list of risks is complete, important risks and other factors that could cause actual results to differ materially from those contemplated by forward-looking statements include, but are not limited to: economic or business conditions in Texas, the United States or globally that impact TCBI or its customers; negative credit quality developments arising from the foregoing or other factors, including trade policies, inflation, unemployment rates and interest rates; TCBI's ability to innovate, to anticipate the needs of our current and future customers and to manage increased or expanded competition from banks and other financial service providers in TCBI's markets; TCBI's ability to effectively manage its liquidity and maintain adequate regulatory capital to support its businesses; TCBI's ability to pursue and execute upon growth plans, whether as a function of capital, liquidity or other limitations; TCBI's ability to successfully execute its business strategy, including its strategic plan and developing and executing new lines of business, products and services; risks related to potential strategic acquisitions, including the risk that TCBI may not be able to consummate acquisitions on favorable terms, if at all, and the risk that TCBI may not realize the anticipated benefits from acquisitions; the extensive regulations to which TCBI is subject and its ability to comply with applicable governmental regulations, including legislative and regulatory changes; TCBI's ability to effectively manage information technology systems, including third party vendors, cyber or data privacy incidents or other failures, outages, disruptions or security breaches; TCBI's ability to use technology to provide products and services to its customers; risks related to the development and use of artificial intelligence; changes in interest rates, including the impact of interest rates on TCBI's securities portfolio and funding costs, as well as related balance sheet implications stemming from the fair value of our assets and liabilities; the effectiveness of TCBI's risk management processes strategies and monitoring; fluctuations in commercial and residential real estate values, especially as they relate to the value of collateral supporting TCBI's loans; TCBI's ability to manage any unexpected outflows of uninsured deposits and avoid selling investment securities or other assets at an unfavorable time or at a loss; adverse developments in the banking industry and the potential impact of such developments on customer confidence, liquidity and regulatory responses to these developments, including in the context of regulatory examinations and related findings and actions; negative press and social media attention with respect to the banking industry or TCBI, in particular; claims, litigation or regulatory investigations and actions that TCBI may become subject to; the failure to identify, attract and retain key personnel and other employees and to engage in adequate succession planning; severe weather, natural disasters, climate change, acts of war, terrorism, global or other geopolitical conflicts, or other external events, as well as related legislative and regulatory initiatives; and the risks and factors more fully described in TCBI's most recent Annual Report on Form 10-K, Quarterly Reports on Form 10-Q and other documents and filings with the SEC. The information contained in this communication speaks only as of its date. Except to the extent required by applicable law or regulation, we disclaim any obligation to update such factors or to publicly announce the results of any revisions to any of the forward-looking statements included herein to reflect future events or developments.TEXAS CAPITAL BANCSHARES, INC.SELECTED FINANCIAL HIGHLIGHTS (UNAUDITED)(dollars in thousands except per share data) 4th Quarter3rd Quarter2nd Quarter1st Quarter4th Quarter 2025 2025 2025 2025 2024 CONSOLIDATED STATEMENTS OF INCOME Interest income$444,314 $460,615 $439,567 $427,289 $437,571 Interest expense 176,877 188,844 186,172 191,255 207,964 Net interest income 267,437 271,771 253,395 236,034 229,607 Provision for credit losses 11,000 12,000 15,000 17,000 18,000 Net interest income after provision for credit losses 256,437 259,771 238,395 219,034 211,607 Non-interest income 60,046 68,583 54,069 44,444 54,074 Non-interest expense 184,198 190,575 190,276 203,020 172,159 Income before income taxes 132,285 137,779 102,188 60,458 93,522 Income tax expense 31,626 32,569 24,860 13,411 22,499 Net income 100,659 105,210 77,328 47,047 71,023 Preferred stock dividends 4,312 4,313 4,312 4,313 4,312 Net income available to common stockholders$96,347 $100,897 $73,016 $42,734 $66,711 Diluted earnings per common share$2.12 $2.18 $1.58 $0.92 $1.43 Diluted common shares 45,509,370 46,233,167 46,215,394 46,616,704 46,770,961 CONSOLIDATED BALANCE SHEET DATA Total assets$31,540,274 $32,536,980 $31,943,535 $31,375,749 $30,731,883 Loans held for investment 17,976,183 18,134,059 18,035,945 17,654,243 17,234,492 Loans held for investment, mortgage finance 6,064,019 6,057,804 5,889,589 4,725,541 5,215,574 Loans held for sale 4,361 — — — — Interest bearing cash and cash equivalents 1,897,803 2,852,387 2,507,691 3,600,969 3,012,307 Investment securities 4,723,099 4,601,654 4,608,628 4,531,219 4,396,115 Non-interest bearing deposits 6,959,097 7,689,598 7,718,006 7,874,780 7,485,428 Total deposits 26,448,767 27,505,398 26,064,309 26,053,034 25,238,599 Short-term borrowings 330,000 275,000 1,250,000 750,000 885,000 Long-term debt 620,575 620,416 620,256 660,521 660,346 Stockholders' equity 3,631,382 3,637,098 3,510,070 3,429,774 3,367,936 End of period shares outstanding 44,253,688 45,679,863 45,746,836 46,024,933 46,233,812 Book value per share$75.28 $73.05 $70.17 $68.00 $66.36 Tangible book value per share(1)$75.25 $73.02 $70.14 $67.97 $66.32 SELECTED FINANCIAL RATIOS Net interest margin 3.38% 3.47% 3.35% 3.19% 2.93%Return on average assets 1.22% 1.30% 0.99% 0.61% 0.88%Return on average assets, adjusted(4) 1.20% 1.30% 1.02% 0.61% 0.88%Return on average common equity 11.18% 12.04% 9.17% 5.56% 8.50%Return on average common equity, adjusted(4) 10.98% 12.04% 9.48% 5.56% 8.50%Efficiency ratio(2) 56.2% 56.0% 61.9% 72.4% 60.7%Efficiency ratio, adjusted(2)(4) 56.9% 56.0% 61.1% 72.4% 60.7%Non-interest income to average earning assets 0.76% 0.88% 0.72% 0.60% 0.69%Non-interest income to average earning assets, adjusted(4) 0.76% 0.88% 0.74% 0.60% 0.69%Non-interest expense to average earning assets 2.33% 2.44% 2.52% 2.75% 2.21%Non-interest expense to average earning assets, adjusted(4) 2.35% 2.44% 2.50% 2.75% 2.21%Common equity to total assets 10.6% 10.3% 10.1% 10.0% 10.0%Tangible common equity to total tangible assets(3) 10.6% 10.3% 10.1% 10.0% 10.0%Common Equity Tier 1 12.1% 12.1% 11.4% 11.6% 11.4%Tier 1 capital 13.6% 13.6% 12.9% 13.1% 12.8%Total capital 16.1% 16.1% 15.3% 15.6% 15.4%Leverage 11.7% 11.9% 11.8% 11.8% 11.3%(1) Stockholders' equity excluding preferred stock, less goodwill and intangibles, divided by shares outstanding at period end.(2) Non-interest expense divided by the sum of net interest income and non-interest income.(3) Stockholders' equity excluding preferred stock, less goodwill and intangibles, divided by total assets, less goodwill and intangibles.(4) These adjusted measures are non-GAAP measures. Please refer to "GAAP to Non-GAAP Reconciliations" for the computations of these adjusted measures and the reconciliation of these non-GAAP measures to the most directly comparable GAAP measure.TEXAS CAPITAL BANCSHARES, INC.CONSOLIDATED BALANCE SHEETS (UNAUDITED)(dollars in thousands) December 31,2025September 30,2025June 30,2025March 31,2025December 31,2024Assets Cash and due from banks$201,315 $212,438 $182,451 $201,504 $176,501 Interest bearing cash and cash equivalents 1,897,803 2,852,387 2,507,691 3,600,969 3,012,307 Available-for-sale debt securities 3,951,455 3,801,261 3,774,141 3,678,378 3,524,686 Held-to-maturity debt securities 725,722 743,120 761,907 779,354 796,168 Equity securities 41,998 55,054 68,692 71,679Full story available on Benzinga.com
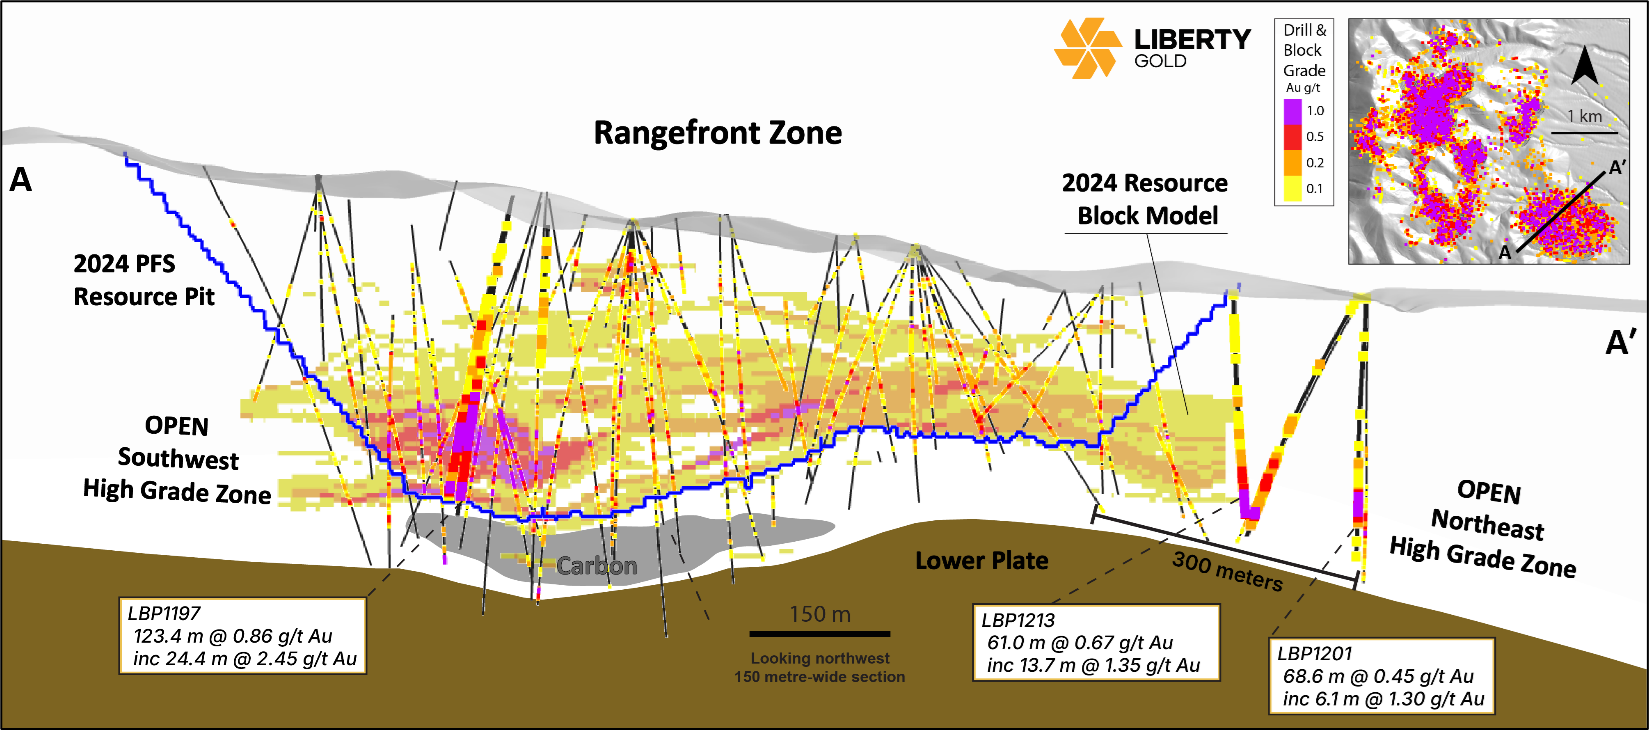
0.86 g/t Au over 123.4 meters, including 2.45 g/t Au over 24.4 meters in LBP1197 0.67 g/t Au over 61.0 meters in LBP1213, a 175-meter step-out at Rangefront Zone