in_tradingview21d ago
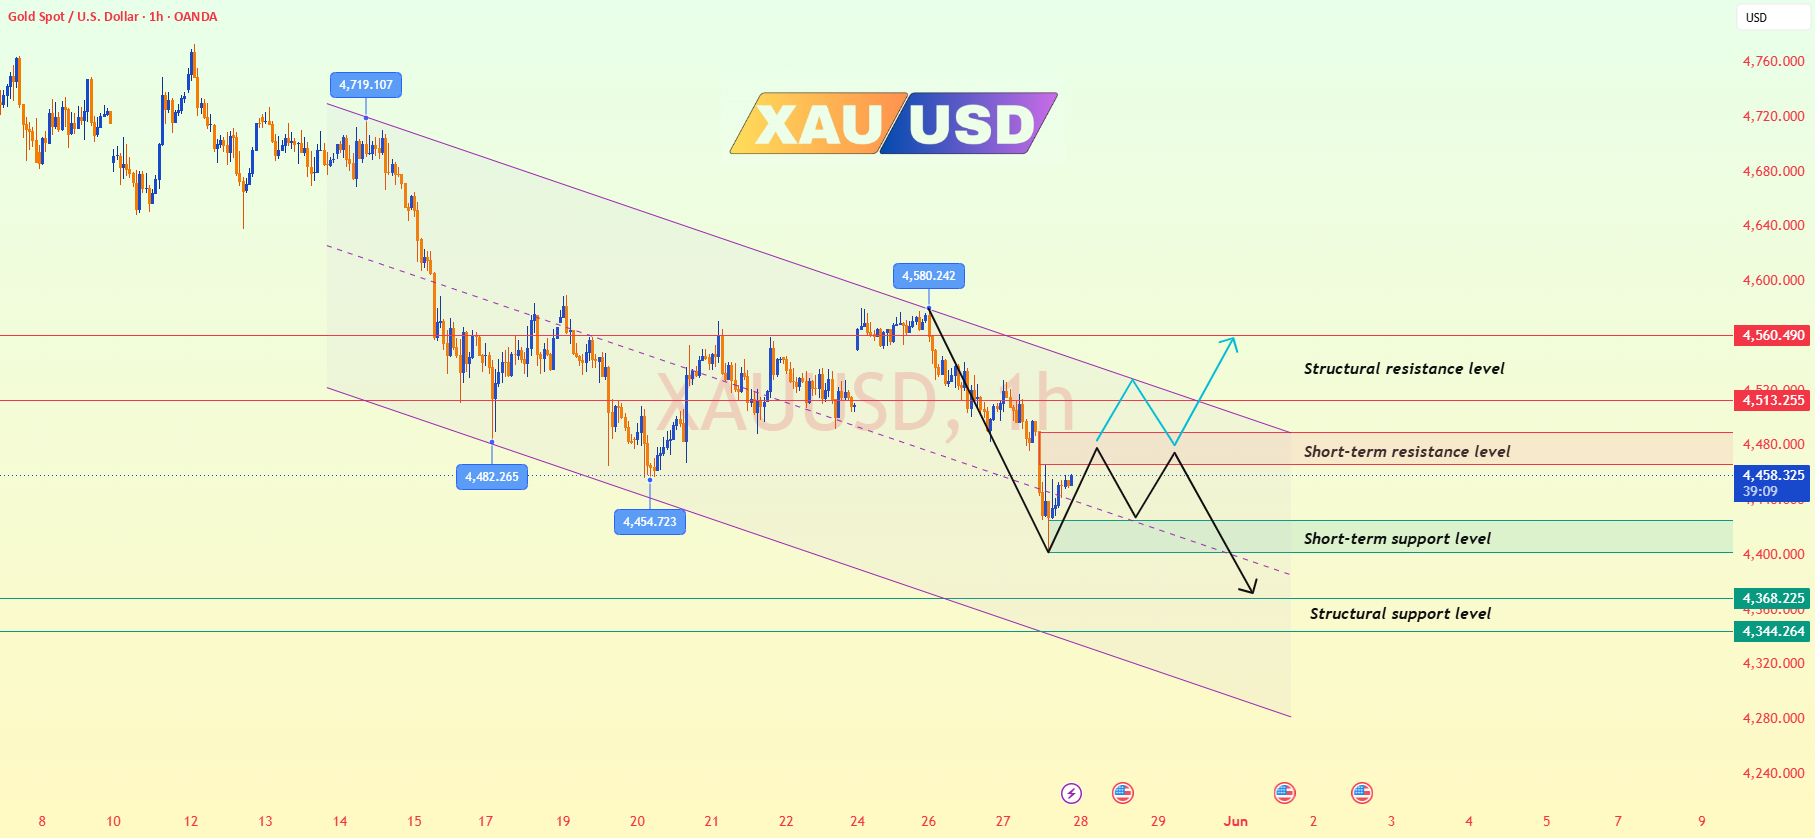
🌐Hello traders! I’m Jack Blackwell, with 15 years of experience in gold and forex market analysis and trading. Below are my analysis views based on the current XAUUSD chart structure on the 4-hour and 1-hour timeframes. ✅ 4-Hour Trend Analysis From the current 4-hour candlestick chart, gold has clearly returned to a bearish structure overall. The price has already dropped to around 4401. Although a short-term technical rebound has appeared, the overall movement still represents a “weak recovery after a decline.” ✅ 1-Hour Trend Analysis The 1-hour chart shows that after breaking below the 4466 and 4425 support levels, gold quickly declined toward 4401, followed by a short-term oversold rebound. The price has now rebounded to around 4450. Although MA5 has started to turn upward, MA10 and MA20 still maintain a bearish alignment, and the price is still trading below MA20, indicating that the strength of the rebound remains limited. At the same time, the descending trendline resistance is still in place, with the 4460–4475 zone forming a clear short-term resistance area. Therefore, the current 1-hour structure is still more consistent with a “weak recovery after a decline” rather than a trend reversal. 📊 Key Fibonacci Retracement Levels ● 23.6%: 4443 ● 38.2%: 4469 ● 50%: 4490 ● 61.8%: 4512 🔴 Resistance Levels ● 4460–4475 (short-term rebound resistance) ● 4490 (50% retracement resistance) ● 4512–4524 (strong resistance zone) ● 4560 (key 4-hour top resistance) 🟢 Support Levels ● 4435–4425 (short-term support) ● 4401 (recent swing low) ● 4368 (next target support) ● Around 4320 (if further breakdown occurs) ✅ Trading Strategy Reference 🔰 Sell on Rebounds Strategy (Main Trend Strategy) 👉 Reference Zone: 4470 – 4490 🎯 Targets: 4435 → 4401 → 4368 📍 Logic: ● The 4-hour trend remains bearish ● MA20 and the descending trendline form strong confluence resistance ● The rebound is more likely a technical correction 🔰 Oversold Short-Term Buy Strategy (Light Positions, Quick Trades) 👉 Reference Zone: 4405 – 4425 🎯 Targets: 4445 → 4465 🛑 Stop Loss: Below 4390 📍 Logic: ● The 4400 area provides short-term oversold support ● Technical rebounds are more likely near the lower Bollinger Band ⚠️ Key Market Outlook 👉 If the price breaks below 4401 again, bearish momentum could accelerate further toward 4368 or even 4320. 👉 If the price stabilizes above 4469, the market may continue rebounding toward the 4490–4512 zone. 👉 If the price fails to break above 4490, the market will most likely return to the main bearish rhythm of “rebounding first, then continuing lower.” 🔔 If you find this analysis helpful, please support me by liking and commenting, which will encourage me to share more high-quality content. Also, feel free to share your thoughts on the future price movement of this chart!