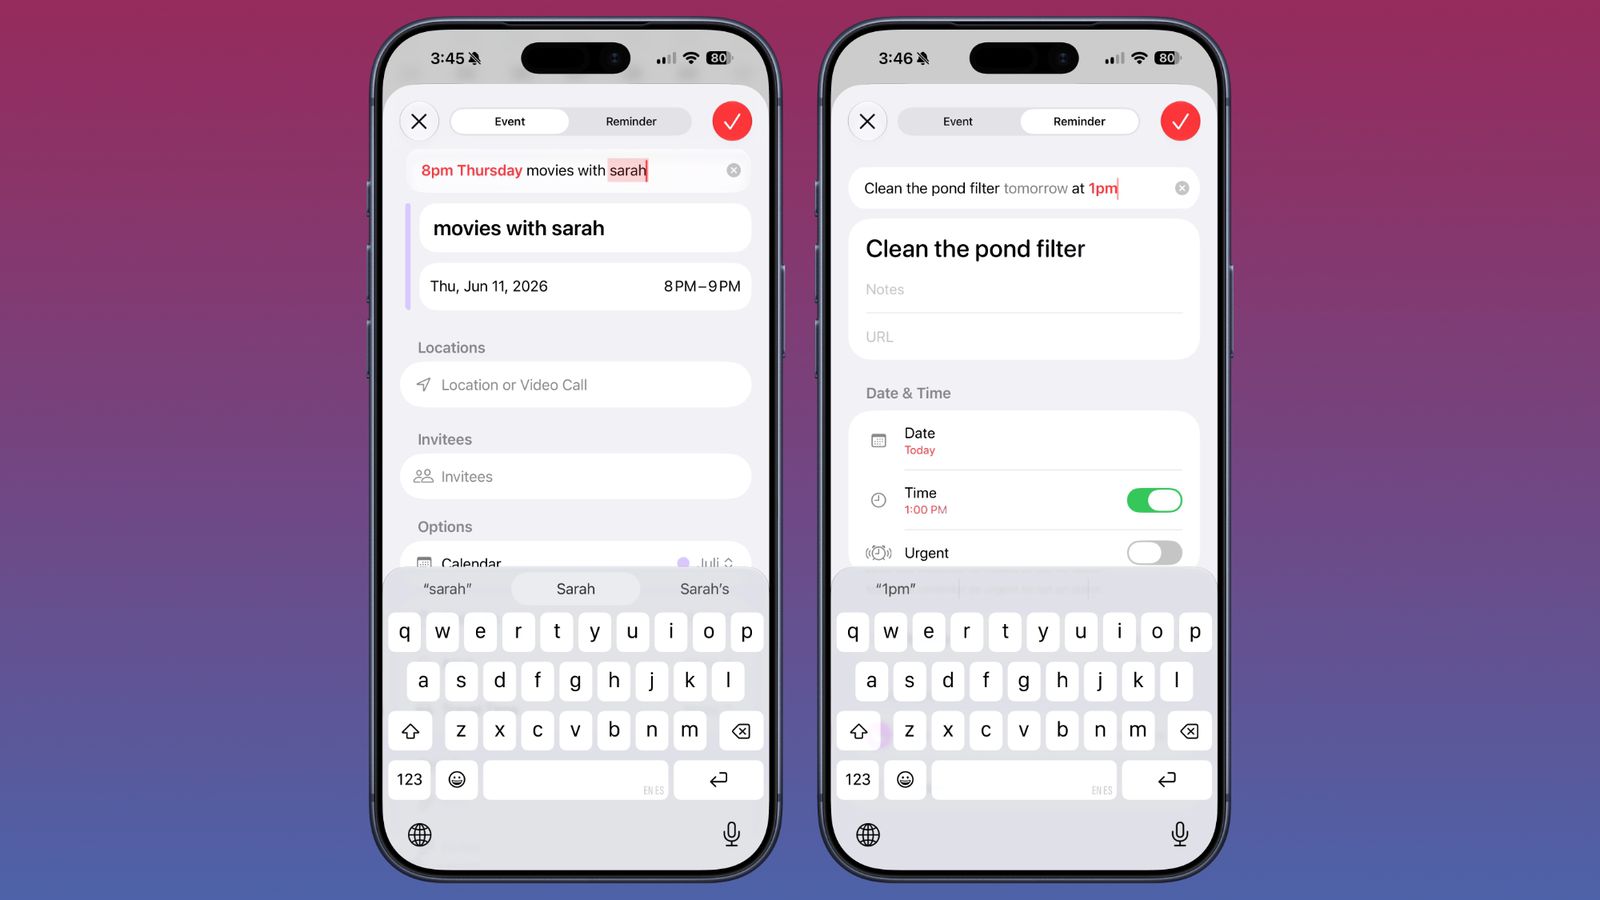
Dashboard

Financial News

Will $DOGEBALL Hit $0.015? Why Analysts Call it the Best Crypto to Hold in 2026 Over ARB and ICP
techbullion14d ago

Will $DOGEBALL Hit $0.015? Why Analysts Call it the Best Crypto to Hold in 2026 Over ARB and ICP

The cryptocurrency market is witnessing a tectonic shift in investor sentiment. As highlighted by recent reports from CryptoSlate, Bitcoin’s price action is aggressively retesting the $75,000 mark, fueled by a renewed appetite for assets that offer more than just speculative value. This surge is coinciding with the rise of high-utility projects like G-Coin by Playnance, [...] The post Will $DOGEBALL Hit $0.015? Why Analysts Call it the Best Crypto to Hold in 2026 Over ARB and ICP appeared first on TechBullion .

#CRYPTO
Ethereum Price Faces Downside Risk, Bears Prepare for Fresh Move
newsbtc14d ago

Ethereum Price Faces Downside Risk, Bears Prepare for Fresh Move

Ethereum price started a recovery wave above the $2,120 zone. ETH is now consolidating above $2,140 and is struggling to clear the $2,200 resistance. Ethereum started a recovery wave above the $2,150 zone. The price is trading above $2,120 and the 100-hourly Simple Moving Average. There is a new bearish trend line with forming resistance at $2,175 on the hourly chart of ETH/USD (data feed via Kraken). The pair could start a fresh decline if it stays below the $2,205 resistance. Ethereum Price Faces Resistance Ethereum price managed to stay above $2,050 and started a recovery wave, like Bitcoin. ETH price was able to climb above the $2,080 and $2,120 resistance levels. The price cleared the 38.2% Fib retracement level of the downward move from the $2,385 swing high to the $2,025 low. However, the bears seem to be active below the $2,200 resistance. There is also a new bearish trend line with forming resistance at $2,175 on the hourly chart of ETH/USD. Ethereum price is now trading above $2,140 and the 100-hourly Simple Moving Average. If the bulls remain in action above $2,100, the price could attempt another increase. Immediate resistance is seen near the $2,175 level and the trend line. The first key resistance is near the $2,205 level or the 50% Fib retracement level of the downward move from the $2,385 swing high to the $2,025 low. The next major resistance is near the $2,250 level. A clear move above the $2,250 resistance might send the price toward the $2,300 resistance. An upside break above the $2,300 region might call for more gains in the coming days. In the stated case, Ether could rise toward the $2,345 resistance zone or even $2,365 in the near term. Another Drop In ETH? If Ethereum fails to clear the $2,175 resistance, it could start a fresh decline. Initial support on the downside is near the $2,120 level. The first major support sits near the $2,100 zone. A clear move below the $2,100 support might push the price toward the $2,065 support. Any more losses might send the price toward the $2,020 region. The main support could be $2,000. Technical Indicators Hourly MACD – The MACD for ETH/USD is losing momentum in the bullish zone. Hourly RSI – The RSI for ETH/USD is now below the 50 zone. Major Support Level – $2,065 Major Resistance Level – $2,175

#CRYPTO
forexnewsreport14d ago

Cotton Reverting Higher at Midday

Cotton futures are trading with midday gains of 30 to 35 points at midday. Crude oil is up $5.09 on the day. The US dollar index is $0.685 higher at $99.410. The Seam showed sales of 4,911 bales on March 23, averaging 66.47 cents/lb. The Cotlook A Index was down 40 points on Monday at [...] The post Cotton Reverting Higher at Midday first appeared on FOREX NEWS REPORT .

#FOREX