organiser10d ago
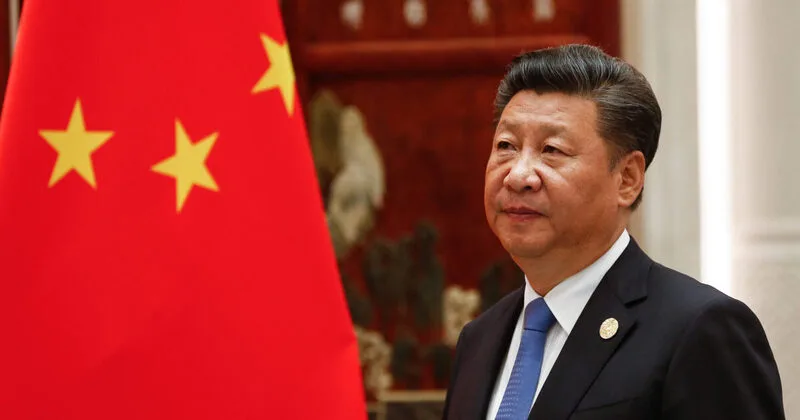
For much of the past two decades, China’s rise was defined by rapid economic expansion, infrastructure development, urbanisation, export-led manufacturing, and the growth of a dynamic private sector. Economic performance became one of the central pillars of legitimacy for the Chinese Communist Party (CCP), helping it maintain public support while transforming China into the world’s second-largest economy. Today, however, a different priority appears to be shaping Beijing’s policy direction. As China struggles with a prolonged economic slowdown, the CCP under Xi Jinping is increasingly placing political security, regime preservation, and social control ahead of economic growth. Although Chinese authorities continue to publicly promote growth targets and economic recovery, a series of recent policy decisions, regulatory interventions, and governance reforms suggest that regime security considerations are now taking precedence over market expansion, private enterprise, and international business engagement. The emerging pattern indicates a fundamental shift in governance philosophy, where economic activity is increasingly evaluated through the prism of political stability and state control rather than productivity and growth. Security above development Since Xi Jinping assumed power in 2012, the concept of “security” has steadily expanded across China’s policy framework. What was once largely confined to traditional national security concerns has evolved into a comprehensive governance doctrine encompassing national security, economic security, financial security, food security, energy security, supply-chain security, data security, and social stability. Under this framework, virtually every sector of Chinese society and the economy is viewed as having potential implications for regime security. The growing prominence of security-related priorities has become increasingly visible in recent months through a series of regulatory actions affecting technology companies, overseas investment, information dissemination, military affairs, and private businesses. The trend has alarmed several China-based analysts who spoke to foreign media under conditions of anonymity due to concerns about potential reprisals. According to these observers, the CCP’s priorities have undergone a decisive transformation. They argue that current policy indicators suggest the leadership is no longer primarily focused on accelerating economic development. Instead, attention has shifted towards countering perceived threats, identifying alleged espionage activities, and addressing what authorities describe as destabilising factors. Their assessment reflects a broader perception that political considerations now outweigh economic objectives. In the CCP’s governance model, politics increasingly overrides all other concerns, reducing economic development to a secondary role. The shift did not occur overnight. Analysts trace its acceleration to the period following constitutional changes associated with the CCP’s 19th Party Congress era, during which presidential term limits were removed and Xi’s authority was further consolidated. Since then, the balance between economic liberalisation and political control has tilted steadily in favour of the latter. Expanding state control over business One of the most visible manifestations of this transformation has been the CCP’s growing involvement in the private sector. Over recent years, Party influence within businesses has expanded through organisational mechanisms, mergers, acquisitions, and strengthened Party structures inside private firms. The process intensified following the pandemic lockdown period, when regulatory pressure on major private enterprises increased significantly. Critics argue that state authorities have increasingly relied on tax investigations and regulatory mechanisms to expand government influence over successful companies. Concerns about the business environment have also been heightened by new judicial interpretations that came into effect on May 1. These legal changes have raised questions among entrepreneurs, foreign investors, and corporate executives regarding rising regulatory and legal risks associated with operating in China. Further evidence of Beijing’s security-centric approach emerged on June 1, when China’s State Council announced new regulations governing outbound investment. According to information released through state media, including Xinhua News Agency via the Ministry of Commerce, the regulations tighten controls over the movement of capital, technology, services, and data beyond China’s borders. The following day, the Cyberspace Administration of China introduced additional regulations governing cross-platform online content distribution. The new measures expanded official oversight over information-sharing activities and subjected additional forms of digital communication to regulatory scrutiny. Also Read: World Bank praises India’s economic resilience, highlights opportunities in manufacturing and food processing The outbound investment regulations, scheduled to take effect on July 1, provide a particularly clear illustration of the CCP’s evolving priorities. Under the new rules, Chinese investors are prohibited from exporting or utilising abroad any goods, technologies, services, or related data that are subject to export bans. Transfers involving restricted technologies, services, or data require prior government approval. The restrictions extend even further. Controlled technologies and data may not be transferred through overseas employment arrangements, technical consulting, personnel assignments, training programmes, or other international professional exchanges without authorisation. Beijing has defended these measures as necessary safeguards for national interests and national security. Critics, however, contend that the regulations could further limit private-sector flexibility, discourage international cooperation, and increase uncertainty for businesses already operating in a difficult economic environment. Also Read: Pakistan’s Proxy War 2.0: How Dawood-ISI network is building a new sharpshooter army in India Stability maintenance as a governing doctrine The CCP’s emphasis on regime security extends beyond economic management into local governance and social administration. Across China, local governments are increasingly focused on maintaining political stability and strengthening mechanisms of social control. Official rhetoric frequently presents grassroots governance initiatives as efforts to improve public services and community management. Critics argue, however, that the underlying objective is often the preservation of political authority and the reinforcement of state control. Local officials are increasingly responsible for implementing highly detailed social-management systems. These include stability-maintenance programmes, accountability structures, monitoring mechanisms, and early-warning networks designed to identify and neutralise potential sources of social unrest before they develop into larger challenges. The responsibilities assigned to grassroots cadres have become more extensive and more precisely defined. Their performance is regularly monitored and evaluated, reflecting the importance Beijing places on maintaining social control at every level of governance. This approach reveals a broader transformation in how the Chinese leadership views economic management itself. Increasingly, economic policy is treated as a component of a wider security framework. Rather than asking whether a policy maximises efficiency, stimulates investment, or promotes growth, policymakers appear increasingly concerned [...]