in_tradingview80d ago
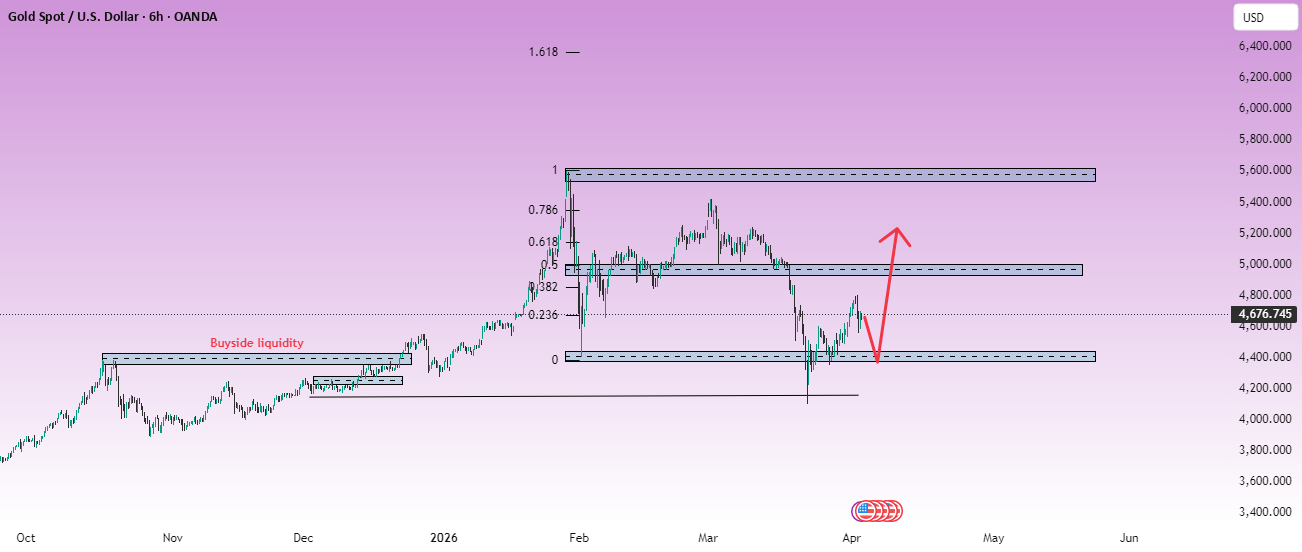
Gold Recovery Is Active, but the Market Still Needs to Reclaim Higher Structure XAUUSD is reacting from support, though the broader recovery still needs confirmation through resistance. Gold is trying to stabilize after the recent corrective decline, with price now holding above a key support base around the 4,400 area. That reaction matters because it shows buyers are still defending lower value, even after the earlier rejection from higher levels. From a broader technical perspective, the chart is no longer in a clean sell-off phase. The market has already produced a meaningful response from support, and that keeps the rebound scenario alive. But the structure is not fully bullish yet. Price is still trading below the more important resistance layers above, which means buyers need to reclaim ground before the next upside leg can be treated as a stronger continuation. Technical Structure The chart shows a clear recovery map. Gold has reacted from the 4,400 demand zone, which is now the first level protecting the current rebound. As long as this area remains intact, the market has room to push higher into the next resistance band around 5,000. Above that, the more important supply zone comes in near 5,600. This is the broader sell-side liquidity area and the main upside cap on the chart. If momentum improves and buyers manage to reclaim the mid-range resistance first, that higher zone becomes the next meaningful destination. So the structure is straightforward: support is active, recovery is valid, but the market still needs to earn continuation by reclaiming resistance step by step. Key Price Zones Immediate Support: 4,400 area This is the first level holding the current rebound together. If gold stays above it, buyers retain short-term control. Mid-Range Resistance: 5,000 area This is the first major upside test. A move into this zone would show the recovery is gaining traction. Major Sell-Side Liquidity: 5,600 area This is the broader upside target and the more important resistance cap on the chart. Market Scenarios Scenario 1 – Hold support and continue higher This is the constructive scenario. If buyers continue defending the 4,400 base, gold may extend the recovery into the 5,000 resistance area. A stronger break there would open the way towards the broader liquidity zone near 5,600. Scenario 2 – Pull back first, then recover This is also realistic. The market may still retest the support base before moving higher again. As long as price holds above the lower zone, that dip would still be corrective rather than bearish. Scenario 3 – Lose support and weaken again If gold falls back below the support structure decisively, the rebound weakens and the market could rotate into a deeper corrective phase before buyers attempt to rebuild control. Market Insight What stands out here is that gold has found support at an important area, but the chart is still asking for confirmation. The rebound is real, yet the market remains below higher resistance, which means this is still a recovery in progress rather than a fully established bullish expansion. For now, the message is clear: gold is recovering from support, but the next leg higher still depends on whether buyers can reclaim the structure above with real momentum.