Dashboard

Financial News

GoSats Bags $5 Mn To Scale Its Rewards Platform
startupnews78d ago

GoSats Bags $5 Mn To Scale Its Rewards Platform

SUMMARY The round was led by US-based VC firm Konvoy Ventures, with participation from existing backer Y Combinator and Web3-focused Taisu Ventures GoSats plans to expand its rewards ecosystem to include new asset classes and deepen partnerships with consumer brands and fintech platforms GoSats is a rewards platform that offers assets like Bitcoin and gold [...]

#COMMODITIES
Bullish Recovery or Bearish Breakdown Below Resistance?
in_tradingview78d ago

Bullish Recovery or Bearish Breakdown Below Resistance?

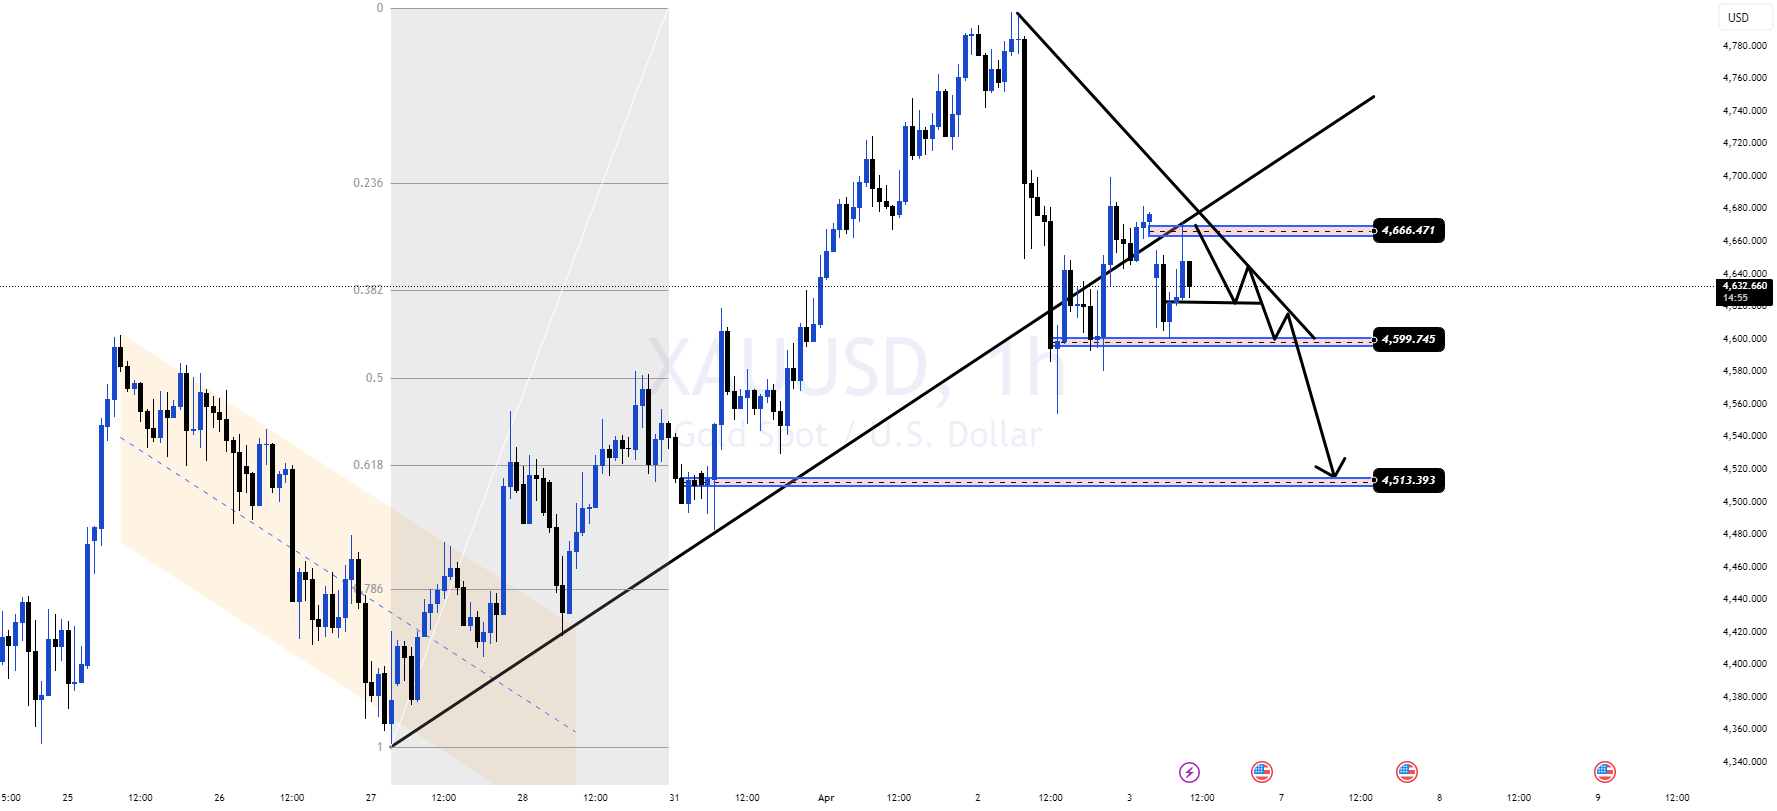
Gold is now trading at a critical decision area after a strong rally lost momentum near the highs and price started to rotate lower. On the H1 chart, the broader structure is no longer in a clean impulsive uptrend. After the sharp rejection from the top, price broke away from the previous buying leg and is now moving inside a more compressed reaction phase, trapped between key resistance and support zones. What makes this area important is that gold is currently reacting around the 4,599 support while still failing to reclaim the 4,666 resistance zone. This creates a clear short-term battlefield between recovery and continuation selling. Market Structure The previous buying move has already slowed down Price failed to hold near the highs and sold off aggressively Current rebound looks corrective, not yet a confirmed bullish reversal Structure is now shifting into a lower-high reaction phase At this stage, gold is trading in a fragile zone. Buyers are trying to defend support, but sellers still control the upper structure unless price can break back above resistance. Key Price Zones 4,666.471 – Main Resistance This is the nearest supply zone and the most important upside barrier in the current structure. If price pushes into this level but gets rejected again, it would confirm that the rebound is only a pullback inside a weaker structure. A clean reclaim above this zone would be the first sign that buyers are regaining control. 4,599.745 – First Support This is the immediate support area price is reacting from right now. If this level holds, gold may continue to rebound toward 4,666. If it breaks, downside pressure could accelerate quickly. 4,513.393 – Major Support / Bearish Target This is the deeper support zone and also the next major downside objective shown on the chart. If 4,599 fails, price may extend lower into 4,513, where a stronger reaction could appear. Trend Read The market is currently in a short-term corrective-to-bearish phase. Why: Price rejected sharply from the top The descending trendline is still capping recovery Current bounce has not broken resistance Lower-high behavior is starting to develop So for today, the market is not in a clean bullish continuation structure. It is trading under resistance, with downside risk still active. Trading Scenarios for Today Scenario 1: Price fails below 4,666 If gold continues to reject below 4,666, the rebound is likely just a corrective retest. In that case: sellers may step back in price could revisit 4,599 and if support breaks, the next target sits around 4,513 This is the more bearish intraday scenario. Scenario 2: Price breaks and holds above 4,666 If buyers manage to reclaim 4,666 with strong follow-through, short-term sentiment may shift. That would suggest: the rebound is gaining strength bearish pressure is weakening price may attempt a larger recovery into higher resistance But until that breakout happens, bullish continuation remains unconfirmed. Scenario 3: Price breaks below 4,599 If 4,599 gives way, the chart opens room for a deeper decline. That would likely trigger: more liquidation from late buyers renewed bearish momentum a move toward 4,513 This is the key breakdown level to watch. Trading Plan For today, the market favors a reaction-based strategy, not aggressive chasing. Bearish plan Watch for rejection below 4,666 If price fails to break higher, downside pressure may return Main focus: 4,599 first, then 4,513 Bullish plan Bullish setups only become stronger if price reclaims 4,666 Without that breakout, buying positions remain lower quality Buyers need confirmation, not anticipation MMFLOW View This is not the kind of chart where traders should blindly buy support or chase every bounce. The key today is simple: Below 4,666 = market still vulnerable Above 4,666 = recovery becomes more credible Below 4,599 = bearish continuation likely Right now, gold is sitting in a transition zone, and the next clean move will come from how price reacts around resistance, not from guessing direction too early. Conclusion Gold is no longer in a clean bullish expansion. After the sharp rejection from the highs, the market has entered a more defensive structure, with 4,666 acting as resistance and 4,599 acting as key support. Today’s Bias: Neutral to Bearish below 4,666 Rejection below resistance keeps sellers in control Holding above support may create only a temporary rebound A break below 4,599 opens the path toward 4,513 The smarter trade today is not to force a bias. It is to let price confirm whether this is a recovery attempt — or the start of a deeper bearish leg. Short TradingView Caption Gold is trading at a key decision zone after losing momentum from the highs. As long as price stays below 4,666, the rebound still looks corrective. If 4,599 breaks, downside may extend toward 4,513. For now, the chart favors patience and reaction-based execution over chasing price.

#COMMODITIES
XAUUSD – Building structure, but distributing
in_tradingview78d ago

XAUUSD – Building structure, but distributing

XAUUSD – Structure building, but distribution risk still in play Gold is currently holding within a rising structure after the recent recovery, but price behavior is starting to show early signs of hesitation near resistance. The market is not trending cleanly — instead, it is forming a more complex structure that could evolve into a larger pattern. There is increasing alignment between technical signals and broader expectations, pointing toward a potential head and shoulders formation developing on the higher timeframe. Market context Recent analysis suggests that gold may be entering a transitional phase. While long-term fundamentals remain supportive, the current price action reflects a more cautious tone. The market is no longer in an impulsive bullish leg. Instead, it is balancing between recovery and distribution, with volatility still elevated. Technical overview On the H1 structure, gold has built a series of higher lows, supported by the ascending trendline from the recent bottom. Price is currently holding around 4,600–4,650, where demand is still active. However, the upside is facing pressure near 4,700–4,750, which aligns with a key FVG and previous supply zone. The recent rejection from this area suggests that sellers are still defending the upper range. The current structure can be interpreted as a developing right shoulder: Left shoulder and head already formed in the broader structure Current price action potentially shaping the right shoulder Neckline sits near the 4,550–4,600 region A break below this neckline would confirm a deeper downside rotation. Key levels Immediate support / neckline: 4,550 – 4,600 Current price zone: ~4,650 Supply / resistance: 4,700 – 4,750 Upper resistance (FVG): ~4,800 Deeper support (buy zone): ~4,520 Market scenarios Scenario 1 – Right shoulder completes, downside follows If price continues to reject from 4,700–4,750 and breaks below 4,550, the head and shoulders structure may confirm. This opens the path for a deeper move lower toward 4,520 and below. Scenario 2 – Range before decision Price may continue to oscillate between 4,550–4,750, building liquidity before a breakout. This would delay confirmation but not invalidate the structure. Scenario 3 – Bullish continuation If price breaks cleanly above 4,750 and holds, the head and shoulders idea weakens, and gold may extend higher toward 4,800 and beyond. Notes The key element here is not the pattern itself, but the reaction at resistance and support zones. Gold is holding structure, but not expanding strongly. This type of behavior often appears before a directional move, especially when liquidity builds on both sides. For now, gold is at a decision point — either completing a distribution structure or breaking higher. The next move will define the medium-term direction.

#COMMODITIES
Silver price in Pakistan for today, April 06, 2026
pakistantoday78d ago

Silver price in Pakistan for today, April 06, 2026

Silver rates in Pakistan fluctuate frequently based on international market trends. The rates listed are provided by local gold markets and Sarafa Markets in various cities. The post Silver price in Pakistan for today, April 06, 2026 appeared first on Profit by Pakistan Today .

#COMMODITIES
Rupee opens 10 paise higher at 93 against US dollar amid RBI curbs
livemint78d ago

Rupee opens 10 paise higher at 93 against US dollar amid RBI curbs

The Indian rupee started the week positively at 93 against the US dollar, buoyed by recent central bank measures. Despite a 1.8% surge last week, global oil price hikes and geopolitical tensions pose risks to its stability, experts suggest potential fluctuations ahead.

#FOREX
AUD/JPY Forecast: Bullish Momentum Surges as Pair Secures Ground Above Critical 110.00 Level
bitcoinworld78d ago

AUD/JPY Forecast: Bullish Momentum Surges as Pair Secures Ground Above Critical 110.00 Level

BitcoinWorld AUD/JPY Forecast: Bullish Momentum Surges as Pair Secures Ground Above Critical 110.00 Level The AUD/JPY currency pair demonstrates notable resilience in early 2025 trading, firmly establishing itself above the psychologically significant 110.00 threshold. This sustained positioning signals a persistent, albeit mild, bullish bias [...] This post AUD/JPY Forecast: Bullish Momentum Surges as Pair Secures Ground Above Critical 110.00 Level first appeared on BitcoinWorld .

#FOREX
Raja Venkatraman, MarketSmith recommend five stocks for 6 April
livemint78d ago

Raja Venkatraman, MarketSmith recommend five stocks for 6 April

After a three-day break, Indian equity markets are set to resume trading on April 6, with cautious optimism. Analysts suggest buying Adani Power, Anand Rathi Wealth, and Mphasis, while highlighting global tensions and market volatility as key factors influencing investor sentiment.

#FOREX
Canadian Dollar Battles Firmer USD as Surging Oil Prices Provide Critical Support
bitcoinworld78d ago

Canadian Dollar Battles Firmer USD as Surging Oil Prices Provide Critical Support

BitcoinWorld Canadian Dollar Battles Firmer USD as Surging Oil Prices Provide Critical Support The Canadian Dollar (CAD) continues to face significant downward pressure against a resurgent US Dollar (USD) in global forex markets, a trend observed consistently throughout early 2025. However, analysts note [...] This post Canadian Dollar Battles Firmer USD as Surging Oil Prices Provide Critical Support first appeared on BitcoinWorld .

#FOREX
Australian Dollar Plummets as Robust US Jobs Data and Middle East Tensions Fuel Dollar Strength
bitcoinworld78d ago

Australian Dollar Plummets as Robust US Jobs Data and Middle East Tensions Fuel Dollar Strength

BitcoinWorld Australian Dollar Plummets as Robust US Jobs Data and Middle East Tensions Fuel Dollar Strength SYDNEY, Australia – February 2025: The Australian Dollar (AUD) faced significant downward pressure in early 2025, notably softening against a resurgent US Dollar (USD). This movement primarily stemmed from two [...] This post Australian Dollar Plummets as Robust US Jobs Data and Middle East Tensions Fuel Dollar Strength first appeared on BitcoinWorld .

#FOREX