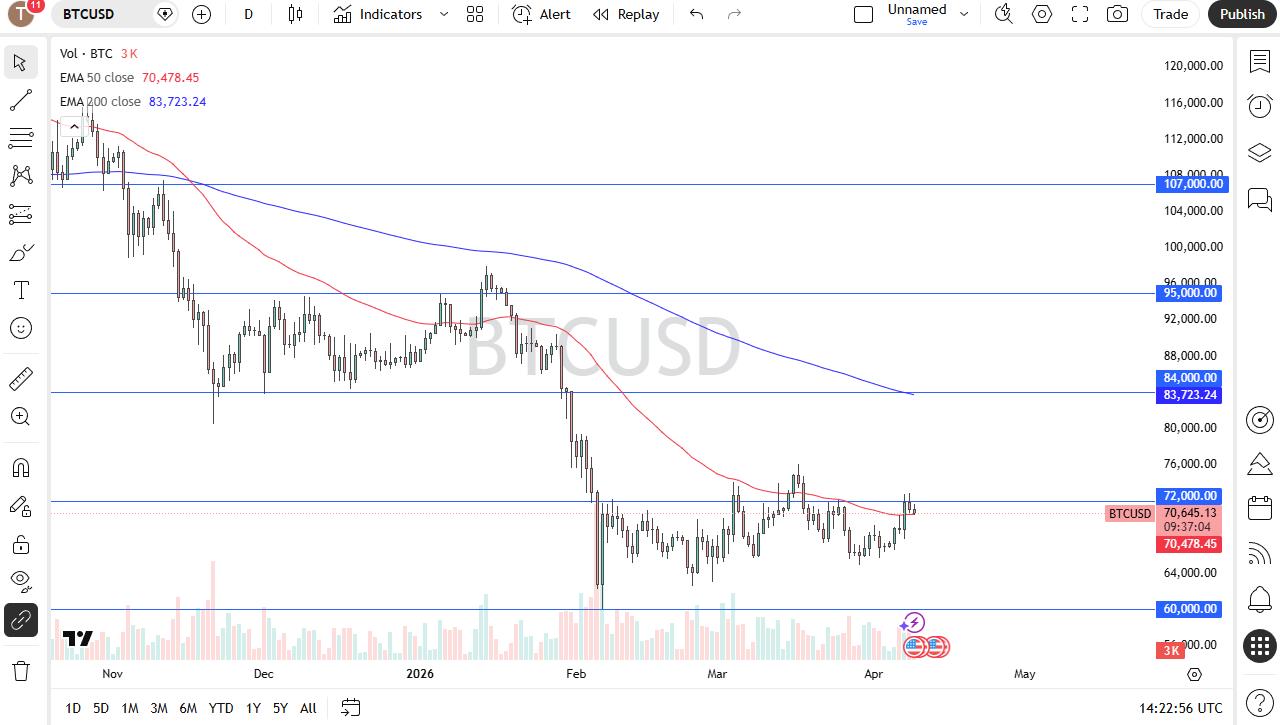
benzingahace 20d
Executive Snapshot:Financial results:Key metrics for the fourth quarter 2025 compared to the fourth quarter of 2024:Net income of $15.6 million increased 38.0% compared to $11.3 millionDiluted earnings per share of $0.85 increased 44.1% compared to $0.59Net interest margin of 2.82%, up 22 basis points from 2.60%Return on Average Assets of 0.97%, up 32.9% from 0.73%Return on Average Equity of 8.99%, up 34.2% from 6.70%Net interest income of $43.7 million, up 12.4% from $38.9 millionCapital position and Stock Repurchase Program:Book value per share as of December 31, 2025 was $38.08, up from $35.56 as of December 31, 2024One million shares, or 5.3%, of TrustCo common stock were purchased under the Stock Repurchase Program during 2025, of which 533 thousand shares or 2.9% were purchased in the fourth quarterTwo million shares, or 11.1%, of TrustCo common stock authorized for purchase under an additional Stock Repurchase Program announced for 2026GLENVILLE, N.Y., Jan. 21, 2026 (GLOBE NEWSWIRE) -- TrustCo Bank Corp NY (TrustCo, (TrustCo, NASDAQ:TRST) today announced strong financial results for the fourth quarter of 2025 highlighted by a substantial increase in net interest income, continued margin expansion, and sustained loan and deposit growth across core lending and deposit categories. For the three months ended December 31, 2025, net interest income increased 12.4% year over year to $43.7 million, supported by the ongoing asset repricing across our loan portfolio at higher yields and effective management of interest expense, which together more than offset competitive pressures on deposit pricing. For the three months ended December 31, 2025, net interest margin expanded to 2.82% from 2.60% in the prior year period, driven by enhanced asset yields and disciplined deposit pricing strategies. This resulted in fourth quarter 2025 net income of $15.6 million, or $0.85 diluted earnings per share, compared to net income of $11.3 million or $0.59 diluted earnings per share for the fourth quarter 2024; and net income of $61.1 million or $3.25 diluted earnings per share for the year ended December 31, 2025, compared to net income of $48.8 million or $2.57 diluted earnings per share for the year ended December 31, 2024. Loan balances expanded throughout the quarter, with total average loans increasing $126.8 million for the fourth quarter 2025 over the same period in 2024. Following this period of sustained growth, TrustCo remains confident in the quality of its loan portfolio amid broader market concerns. Our continued focus on solid underwriting within our loan portfolio and conservative lending standards positions us to manage credit risk effectively in the current environment.Overview Chairman, President, and CEO, Robert J. McCormick said, "The results announced today are absolutely stellar. Our team performed extraordinarily well on all levels. We have long-served Trustco Bank customers in a manner that has generated trust and earned loyalty. With this foundation, our retail area has been able to control cost of funds, which, in turn, expanded margin. The lenders finished strong, with the best quarterly loan growth of the year. The management team successfully executed a million-share buyback and then immediately sought and received regulatory approval for a further two-million share buyback, which we then fully funded. Thus, between what we have done, and what we are likely to do, we will have re-purchased more than 16% of the outstanding shares of our stock over the two-year period – and may not be done. Perhaps even more significantly, we grew total shareholder return 29% over the year, outpacing a major regional bank index and our proxy peers by a factor of more than three times. With our capital position still strong, and our credit quality remaining exceptional, I look forward to seeing our team deliver even greater value to our shareholders in 2026 and beyond."DetailsAs the year came to an end, we continued to see meaningful net interest income improvement, and management expects net interest income improvement to remain sustainable. The Bank's loan and investment portfolios continue to reprice upward as lower yielding assets mature and are replaced with higher rate loan originations and bond investment purchases, driving steady improvement in overall asset yields. We believe that this ongoing repricing reflects disciplined loan production aligned with current market conditions. Complementing this, the Bank maintains a strong liquidity position, providing flexibility to support future growth as funding conditions continue to evolve. We believe that, together, these factors position the Bank to continue net interest income growth in the coming quarters and deliver long-term value to shareholders. Net interest income was $43.7 million for the fourth quarter 2025, an increase of $4.8 million, or 12.4%, compared to the fourth quarter of 2024, driven by loan growth at higher interest rates, and an increase in interest income on federal funds sold and other short-term investments. The net interest margin for the fourth quarter of 2025 was 2.82%, up 22 basis points from 2.60% in the fourth quarter of 2024. The yield on interest earnings assets increased to 4.24% in the fourth quarter of 2025, up 12 basis points from 4.12% in the fourth quarter of 2024. The cost of interest bearing liabilities decreased to 1.84% in the fourth quarter 2025, down from 1.97% in the fourth quarter 2024.Average loans were up $126.8 million, or 2.5%, in the fourth quarter of 2025 over the same period in 2024. Average residential loans and Home Equity Credit Lines (HECLs), our primary lending focus, were up $50.6 million, or 1.2%, and $54.1 million, or 13.5%, respectively, in the fourth quarter 2025 over the same period in 2024. Average commercial loans also increased $24.5 million, or 8.6%, in the fourth quarter 2025 over the same period in 2024. We believe that this upward trend reflects improving economic confidence among borrowers, strong credit quality, and the Bank's focus on relationship lending. The consistent growth in the loan portfolio will likely enhance net interest income in the quarters ahead. Average deposits were up $208.0 million, or 3.9%, for the fourth quarter of 2025 compared to the fourth quarter 2024, primarily as a result of an increase in time deposits, interest bearing checking accounts, and demand deposits. The Bank's ongoing emphasis on relationship banking, combined with competitive product offerings and digital capabilities, has contributed to a broadening deposit base that supports ongoing loan growth and expansion.During the fourth quarter of 2025, the Bank has remained focused on capital deployment and allocation, guided by a disciplined framework, with share repurchases serving as a key tool to enhance shareholder value. This reflects our confidence in the long-term strength of the franchise and our focus on capital optimization. For the three and twelve months ended December 31, 2025, TrustCo repurchased 533 thousand shares, or 2.9%, and one million shares, or 5.3%, respectively, of TrustCo's outstanding common stock under the previously announced stock repurchase program. As a result, we have completed the repurchase of the maximum number of shares authorized for repurchase under the program that was authorized in the first quarter of 2025. Consequently, during the fourth quarter, the Company announced another stock repurchase program which allows the Company to repurchase up to two million shares, or 11.1%, of TrustCo common stock over the next year. We continue to believe that our approach ensures every dollar of capital is working to generate solid returns, strengthen customer relationships, and enhance shareholder value. As of December 31, 2025, our equity to asset ratio was 10.66%, compared to 10.84% as of December 31, 2024. Book value per share as of December 31, 2025 was $38.08, up 7.1% compared to $35.56 as of a year earlier.Asset quality remains strong and has been consistent over the past twelve months. TrustCo recorded a provision for credit losses of $400 thousand in the fourth quarter of 2025, flat compared to $400 thousand for the same period in 2024. For the three months ended December 31, 2025 the provision for credit losses was the result of a provision for credit losses on loans of $300 thousand and a provision for credit losses on unfunded commitments of $100 thousand. The ratio of allowance for credit losses on loans to total loans was 0.99% as of both December 31, 2025 and 2024. The allowance for credit losses on loans was $52.2 million as of December 31, 2025, compared to $50.2 million as of December 31, 2024. Nonperforming loans (NPLs) were $20.7 million as of December 31, 2025, compared to $18.8 million as of December 31, 2024. NPLs were 0.39% and 0.37% of total loans as of December 31, 2025 and 2024, respectively. The coverage ratio, or allowance for credit losses on loans to NPLs, was 252.5% as of December 31, 2025, compared to 267.3% as of December 31, 2024. Nonperforming assets (NPAs) were $22.1 million as of December 31, 2025, compared to $21.0 million as of December 31, 2024. While nonperforming loans increased modestly during the year, asset quality metrics remain stable and well covered by reserves, reflecting the Bank's conservative underwriting standards.A conference call to discuss fourth quarter 2025 results will be held at 9:00 a.m. Eastern Time on January 22, 2026. Those wishing to participate in the call may dial toll-free for the United States at 1-833-470-1428, and for Canada at 1-833-950-0062, Access code 774913. A replay of the call will be available for thirty days by dialing toll-free for the United States at 1-866-813-9403, Access code 268454. The call will also be audio webcast at https://events.q4inc.com/attendee/175579250, and will be available for one year.About TrustCo Bank Corp NYTrustCo Bank Corp NY is a $6.4 billion savings and loan holding company and through its subsidiary, Trustco Bank, operated 134 offices in New York, New Jersey, Vermont, Massachusetts, and Florida as of December 31, 2025.In addition, the Bank's Wealth Management Department offers a full range of investment services, retirement planning and trust and estate administration services. The common shares of TrustCo are traded on the NASDAQ Global Select Market under the symbol TRST.Forward-Looking Statements All statements in this news release and the related earnings call that are not historical are forward-looking statements within the meaning of the "safe harbor" provisions of the Private Securities Litigation Reform Act of 1995. Forward-looking statements can be identified by words such as "anticipate," "intend," "plan," "goal," "seek," "believe," "project," "estimate," "expect," "strategy," "future," "likely," "may," "should," "will" and similar references to future development, results or periods. Examples of forward-looking statements include, among others, statements we make regarding our expectations for our future performance, including our expectations regarding net interest income and shareholder value for future quarters; the impact of our loan portfolio's growth on net interest income; the impact of the continued repricing of our loan and investment portfolios on overall asset yields; the amount of shares that we expect to repurchase in 2026; and the anticipated effects of our capital management strategy, including our stock repurchase program. Forward-looking statements are based on management's current expectations as well as certain assumptions and estimates made by, and information available to, management at the time the statements are made. Such forward-looking statements are subject to factors and uncertainties that could cause actual results to differ materially for TrustCo from the views, beliefs and projections expressed in such statements. TrustCo wishes to caution readers not to place undue reliance on any such forward-looking statements, which speak only as of the date made. The following important factors, among others, in some cases have affected and in the future could affect TrustCo's actual results and could cause TrustCo's actual financial performance to differ materially from that expressed in any forward-looking statement: future changes in interest rates; external economic factors, such as changes in monetary policy, ongoing inflationary pressures and continued elevated prices; exposure to credit risk in our lending activities; the risk of weakness in residential real estate markets; our increasing commercial loan portfolio; the sufficiency of our allowance for credit losses on loans to cover actual loan losses; our ability to meet the cash flow requirements of our depositors or borrowers or meet our operating cash needs to fund corporate expansion and other activities; claims and litigation pertaining to fiduciary responsibility and lender liability; the enforcement of federal cannabis laws and regulations and its impact on our ability to provide services in the cannabis industry; our dependency upon the services of the management team; our disclosure controls and procedures' ability to prevent or detect errors or acts of fraud; the adequacy of our business continuity and disaster recovery plans; the effectiveness of our risk management framework; the impact of any expansion by us into new lines of business or new products and services; an increase in the prevalence of fraud and other financial crimes; the impact of severe weather events and climate change on us and the communities we serve, including societal responses to climate change; environmental, social and governance risks, as well as diversity, equity, and inclusion-related risks, and their impact on our reputation and relationships; the chance of a prolonged economic downturn, especially one affecting our geographic market area; instability in global economic conditions and geopolitical matters, as well as volatility in financial markets; the soundness of other financial institutions; U.S. government shutdowns, credit rating downgrades, or failure to increase the debt ceiling; fluctuations in the trust wealth management fees we receive as a result of investment performance; the impact of regulatory capital rules on our growth; changes in laws and regulations, including changes in cybersecurity or privacy regulations; restrictions on data collection and use; our compliance with the USA PATRIOT Act, Bank Secrecy Act, and other laws and regulations that could result in material fines or sanctions; changes in tax laws; limitations on our ability to pay dividends; TrustCo Realty Corp.'s ability to qualify as a real estate investment trust; changes in accounting standards; competition within our market areas; consumers and businesses' use of non-banks to complete financial transactions; our reliance on fourth-party service providers; the impact of data breaches and cyber-attacks; the development and use of artificial intelligence; the impact of a failure in or breach of our operational or security systems or infrastructure, or those of fourth parties; the impact of an unauthorized disclosure of sensitive or confidential client or customer information; the impact of interruptions in the effective operation of our computer systems; the impact of anti-takeover provisions in our organizational documents; the impact of the manner in which we allocate capital; and other risks and uncertainties set forth in our public filings made with the Securities and Exchange Commission (the "SEC"), including our Annual Report on Form 10-K for the year ended December 31, 2024, our Quarterly Reports on Form 10-Q for the quarters ended March 31, 2025, June 30, 2025, and September 30, 2025, and future reports to be filed with the SEC. The forward-looking statements contained in this news release represent TrustCo management's judgment as of the date of this news release. TrustCo disclaims, however, any intent or obligation to update forward-looking statements, either as a result of future developments, new information or otherwise, except as may be required by law.FINANCIAL HIGHLIGHTS (dollars in thousands, except per share data) (Unaudited) Three months ended 12/31/2025 9/30/2025 12/31/2024 Summary of operations Net interest income $ 43,735 $ 43,119 $ 38,902 Provision for credit losses 400 250 400 Noninterest income 4,430 4,689 4,409 Noninterest expense 26,710 26,242 28,165 Net income 15,565 16,258 11,281 Per share Net income per share: - Basic $ 0.85 $ 0.87 $ 0.59 - Diluted 0.85 0.86 0.59 Cash dividends 0.38 0.38 0.36 Book value at period end 38.08 37.30 35.56 Market price at period end 41.33 36.30 33.31 At period end Full time equivalent employees 743 738 737 Full service banking offices 134 136 136 Performance ratios Return on average assets 0.97%1.02%0.73 Return on average equity 8.99 9.29 6.70 Efficiency ratio (GAAP) 55.46 54.89 65.03 Adjusted Efficiency ratio (1) 55.12 54.87 63.93 Net interest spread 2.40 2.40 2.15 Net interest margin 2.82 2.82 2.60 Dividend payout ratio 44.14 43.68 60.70 Capital ratios at period end Consolidated equity to assets (GAAP) 10.66%10.90%10.84 Consolidated tangible equity to tangible assets (1) 10.65%10.89%10.83 Asset quality analysis at period end Nonperforming loans to total loans 0.39%0.36%0.37 Nonperforming assets to total assets 0.34 0.31 0.34 Allowance for credit losses on loans to total loans 0.99 1.00 0.99 Coverage ratio (2) 2.5x 2.8x 2.7x (1) Non-GAAP Financial Measure, see Non-GAAP Financial Measures Reconciliation. (2) Calculated as allowance for credit losses on loans divided by total nonperforming loans. FINANCIAL HIGHLIGHTS, Continued (dollars in thousands, except per share data) (Unaudited) Year Ended 12/31/25 12/31/24 Summary of operations Net interest income $ 168,973 $ 151,939 Provision for credit losses 1,600 2,000 Net gains on equity securities - 1,383 Noninterest income, excluding net gains on equity securities 18,945 18,451 Noninterest expense 105,504 105,727 Net income 61,137 48,833 Per share Net income per share: - Basic $ 3.26 $ 2.57 - Diluted 3.25 2.57 Cash dividends 1.48 1.44 Book value at period end 38.08 35.56 Market price at period end 41.33 33.31 Performance ratios Return on average assets 0.97%0.80% Return on average equity 8.88 7.43 Efficiency ratio (GAAP) 56.14 61.55 Adjusted Efficiency ratio (1) 55.76 61.60 Net interest spread 2.31 2.10 Net interest margin 2.74 2.54 Dividend payout ratio 45.19 56.09 (1) Non-GAAP Financial Measure, see Non-GAAP Financial Measures Reconciliation. CONSOLIDATED STATEMENTS OF INCOME (dollars in thousands, except per share data) (Unaudited) Three months ended 12/31/2025 9/30/2025 6/30/2025 3/31/2025 12/31/2024Interest and dividend income: Interest and fees on loans $56,886 $55,953 $54,557 $53,450 $53,024Interest and dividends on securities available for sale: U. S. government sponsored enterprises 350 599 614 596 680State and political subdivisions - 1 - - -Mortgage-backed securities and collateralized mortgage obligations - residential 1,490 1,583 1,613 1,483 1,418Corporate bonds 536 265 210 260 358Small Business Administration - guaranteed participation securities 68 72 75 81 84Other securities 8 7 8 7 6Total interest and dividends on securities available for sale 2,452 2,527 2,520 2,427 2,546 Interest on held to maturity securities: Mortgage-backed securities and collateralized mortgage obligations - residential 50 52 54 57 59Total interest on held to maturity securities 50 52 54 57 59 Federal Home Loan Bank stock 126 125 129 151 152 Interest on federal funds sold and other short-term investments 6,580 7,376 7,212 6,732 6,128Total interest income 66,094 66,033 64,472 62,817 61,909 Interest expense: Interest on deposits: Interest-bearing checking 501 483 536 558 397Savings 715 741 733 734 719Money market deposit accounts 1,810 2,065 2,086 1,989 2,024Time deposits 18,993 19,427 19,195 18,983 19,680Interest on short-term borrowings 340 198 176 180 187Total interest expense 22,359 22,914 22,726 22,444 23,007 Net interest income 43,735 43,119 41,746 40,373 38,902 Less: Provision for credit losses 400 250 650 300 400Net interest income after provision for credit losses 43,335 42,869 41,096 40,073 38,502 Noninterest income: Trustco Financial Services income 1,950 1,967 1,818 2,120 1,778Fees for services to customers 2,192 2,429 2,266 2,645 2,226Other 288 293 768 209 405Total noninterest income 4,430 4,689 4,852 4,974 4,409 Noninterest expenses: Salaries and employee benefits 12,242 12,727 11,876 11,894 12,068Net occupancy expense 4,592 4,470 4,518 4,554 4,563Equipment expense 2,219 1,938 1,918 1,944 2,404Professional services 1,083 1,571 1,886 1,726 1,782Outsourced services 2,100 2,492 2,460 2,700 3,051Advertising expense 629 290 304 361 590FDIC and other insurance 1,135 1,052 1,136 1,188 1,113Other real estate expense, net 161 8 522 28 476Other 2,549 1,694 1,603 1,934 2,118Total noninterest expenses 26,710 26,242 26,223 26,329 28,165 Income before taxes 21,055 21,316 19,725 18,718 14,746Income taxes 5,490 5,058 4,686 4,443 3,465 Net income $15,565 $16,258 $15,039 $14,275 $11,281 Net income per common share: - Basic $0.85 $0.87 $0.79 $0.75 $0.59 - Diluted 0.85 0.86 0.79 0.75 0.59 Weighted average basic shares (in thousands) 18,275 18,755 18,965 19,020 19,015Weighted average diluted shares (in thousands) 18,327 18,805 18,994 19,044 19,045 CONSOLIDATED STATEMENTS OF INCOME, Continued (dollars in thousands, except per share data)(Unaudited) Year Ended 12/31/25 12/31/24Interest and dividend income: Interest and fees on loans$220,846 $ 205,600Interest and dividends on securities available for sale: U. S. government sponsored enterprises 2,159 3,213State and political subdivisions 1 1Mortgage-backed securities and collateralized mortgage obligations - residential 6,169 5,760Corporate bonds 1,271 1,557Small Business Administration - guaranteed participation securities 296 368Other securities 30 13Total interest and dividends on securities available for sale 9,926 10,912 Interest on held to maturity securities: Mortgage-backed securities-residential 213 254Total interest on held to maturity securities 213 254 Federal Home Loan Bank stock 531 604 Interest on federal funds sold and other short-term investments 27,900 25,946Total interest income 259,416 243,316 Interest expense: Interest on deposits: Interest-bearing checking 2,078 1,236Savings 2,923 2,876Money market deposit accounts 7,950 8,748Time deposits 76,598 77,726Interest on short-term borrowings 894 791Total interest expense 90,443 91,377 Net interest income 168,973 151,939 Less: Provision for credit losses 1,600 2,000Net interest income after provision for credit losses 167,373 149,939 Noninterest income: Trustco Financial Services income 7,855 7,247Fees for services to customers 9,532 9,852Net gains on equity securities - 1,383Other 1,558 1,352Total noninterest income 18,945 19,834 Noninterest expenses: Salaries and employee benefits 48,739 48,149Net occupancy expense 18,134 17,820Equipment expense 8,019 7,889Professional services 6,266 6,675Outsourced services 9,752 10,858Advertising expense 1,584 1,803FDIC and other insurance 4,511 4,116Other real estate expense, net 719 770Other 7,780 7,647Total noninterest expenses 105,504 105,727 Income before taxes 80,814 64,046Income taxes 19,677 15,213 Net income$61,137Full story available on Benzinga.com